Introduction
Bile acids have a common hydroxyl group located at the 3α position of their steroidal backbone. 3α-HSD (3α-Hydroxysteroid Dehydrogenase) is an enzyme that causes this hydroxyl group to be selectively oxidized in the presence of the co-enzyme NAD (Nicotinamide Adenine Dinucleotide). In this reaction, when a molecule of bile acid is oxidized to 3-ketosteroid one NADH molecule (the reduced form of NAD) is generated and it has intense fluorescence (Ex=340 nm, Em=470 nm). In this method a standard mixture of bile acids was measured using post-column derivatization for detecting NADH generated by continuously mixing the reaction solution containing NAD with the column eluent and passing this mixed solution through a 3α-HSD enzyme-immobilized column.
LC-4000 HPLC system
Experimental
Experimental Condition
Column: Bilepak-II (4.6 mmI.D. x 125 mmL, 5 µm)
Enzyme Column: Enzymepak 3α-HSD (4.0 mmI.D. x 20 mmL)
Eluent A: 30 mM Ammonium acetate buffer (pH 6.8)/Acetonitrile/Methanol (60/20/20)
Eluent B: 30 mM Ammonium acetate buffer (pH 6.8)/Acetonitrile/Methanol (40/30/30)
Gradient Condition: (A/B), 0 min (100/0) -> 32 min (0/100) -> 60 min (0/100) -> 60.1 min (100/0) 1 cycle; 80 min
Flow Rate: 1.0 mL/min
Reagent: 0.3 mM NAD, 1 mM EDTA-2Na, 0.05% 2-mercaptoethanol, 10 mM potassium dihydrogenphosphate, pH 7.8 (adjusted with potassium hydroxide)
Reagent Flow Rate: 1.0 mL/min
Column Temp.: 25 ºC
Wavelength: Ex. 345 nm, Em. 470 nm, Gain 100x
Injection Volume: 10 µL
Standard Sample: 15 Bile acids (50 µmol/mL each)
Figure 1 shows the enzyme reaction for the oxidation of bile acids and reduction of NAD.

Figure 1. Mechanism of Enzyme Reaction
Figure 2 shows a flow diagram for the system used to analyze the bile acids.
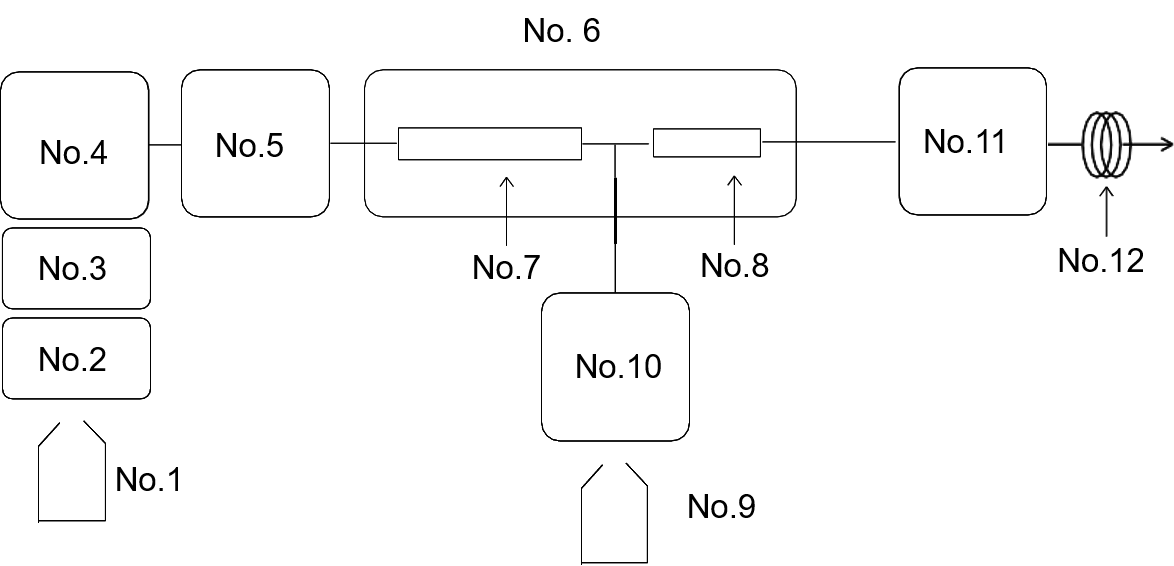
Fig. 2. Flow Diagram
No.1: Eluent, No.2: Quarternary pump, No.3: Cooled Autosampler, No.4: Column oven, No.5: Column (Bilepak II), No.6: Enzyme column (Enzymepak 3a-HSD ), No.7: Reagent, No.8: Reagent pump, No.9: Fluorescence detector, No.10: Backpressure coil
Keywords
Bile acids, NAD, NADH, Enzymepak 3α-HSD, Bilepak-II, Fluorescence detector
Results
Figure 3 shows the chromatogram of a standard mixture of 15 bile acids and an internal standard (I.S.), which were well separated in under 50 minutes.
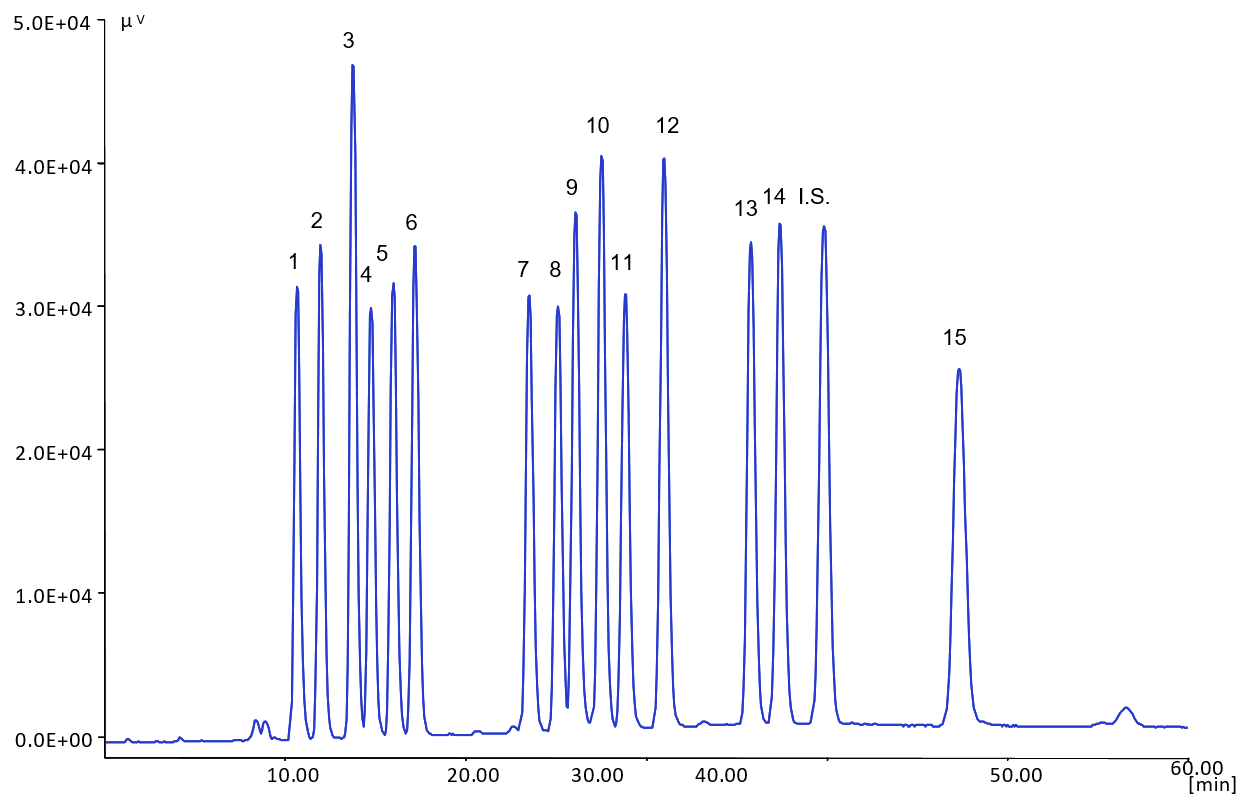
Figure 3. Chromatogram of the Standard Sample of Mixed Bile Acids
1: Glycoursodeoxycholic acid (GUDCA), 2: Tauroursodeoxycholic acid (TUDCA), 3: Ursodeoxycholic acid (UDCA), 4: Glycocholic acid (GCA), 5: Taurocholic acid (TCA), 6: Cholic acid (CA), 7: Glycochenodeoxycholic acid (GCDCA), 8: Taurochenodeoxycholic acid (TCDCA), 9: Glycodeoxycholic acid (GDCA), 10: Taurodeoxycholic acid (TDCA), 11: Chenodeoxycholic acid (CDCA), 12: Deoxycholic acid (DCA), 13: Glycolithocholic acid (GLCA), 14: Taurolithocholic acid (TLCA), I.S.: 5β-pregnan-3α,17α,20α-triol, 15: Lithocholic acid (LCA)
Table 1 shows the retention time and peak area reproducibility of each bile acid when a 0.5 nmol standard mixture of bile acids (injection volume: 10 µL) (n=10). The %RSD of retention time and peak area for each component obtained was 0.2 %~ 0.34% and 0.8% ~ 2.13% respectively.
Table 1. Reproducibility (n = 10)
| Bile acid | %RSD | |
| Retention time | Peak area | |
| GUDCA | 0.34 | 1.43 |
| TUDCA | 0.33 | 1.25 |
| UDCA | 0.28 | 1.47 |
| GCA | 0.33 | 1.36 |
| TCA | 0.33 | 1.16 |
| CA | 0.26 | 1.5 |
| GCDCA | 0.24 | 2.04 |
| TCDCA | 0.23 | 2.13 |
| GDCA | 0.24 | 1.8 |
| TDCA | 0.22 | 1.17 |
| CDCA | 0.2 | 2.11 |
| DCA | 0.2 | 1.16 |
| GLCA | 0.22 | 0.8 |
| TLCA | 0.23 | 0.89 |
| LCA | 0.29 | 1.38 |
Table 2 shows the limit of detection (S/N = 3) of each bile acid. Limit of detection is 3 – 7.5 pmol, and it is expected that this method will be used to measure small volume of bile acids in biological fluid (such as blood) with high-sensitivity and selectability.
| Bile acid | amount (pmol) |
| GUDCA | 4.5 |
| TUDCA | 4.5 |
| UDCA | 3.0 |
| GCA | 4.5 |
| TCA | 4.5 |
| CA | 4.5 |
| GCDCA | 4.5 |
| TCDCA | 4.5 |
| GDCA | 4.5 |
| TDCA | 3.0 |
| CDCA | 4.5 |
| DCA | 3.0 |
| GLCA | 4.5 |
| TLCA | 6.0 |
| LCA | 7.5 |
Related Posts:
 Determination of Absolute Configuration of Molecules…
 Analysis of Amino Acids by On-line Pre-column…
 GPC/SEC measurement of Polystyrene Oligomers using…
 Analysis of Styrofoam by GPC/SEC using mixed gel column
 Rapid Column Screening for Chiral Separation by Parallel SFC
 Analysis of Anionic Surfactants using C8 Column