Introduction
Columns used in GPC/SEC generally have different molecular weight ranges to be measured depending on the pore size of the packing material. On the other hand, mixed gel column types filled with packing materials with various pore sizes can accommodate a wide range of molecular weights.
In this study, we used GPC/SEC column PLgel from AMR, which has the characteristic of obtaining a linear calibration curve by combining and filling multiple packing materials with a single pore size. We compared the separation when using one column and when two columns were connected. We also report the calculation of the molecular weight of Styrofoam under both conditions.
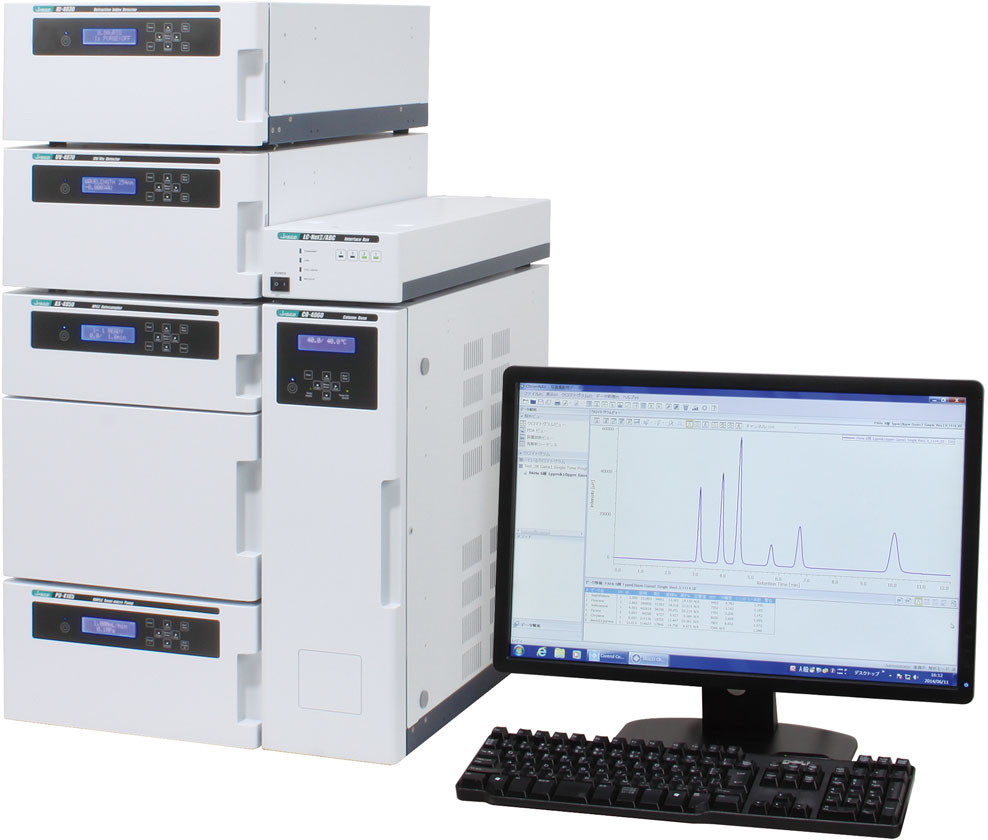
LC-4000 GPC system
Experimental
Instruments
Pump: PU-4180*
Autosampler: AS-4050
Column oven: CO-4060
Detector: RI-4030
* with option units
Conditions
Column: AMR PLgel 10 µm MIXED-B
(7.5 mmI.D. x 300 mmL) x 1 or x 2
Eluent: Tetrahydrofuran (Stabilizer free)
Flow rate: 1.0 mL/min
Column temp.: 40 ºC
Range: STD
Polarity: (+)
Inj. volume: 50 µL
Samples
Standard: Prepared Polystryrene (PS) standard solution (1) and PS standard solution (2) separately (see table below) Dissolved each in mobile phase to a concentration of 0.05 (w/v) %
| PS standard solution | PS molecular weight | n-propyl benzene molecular weight |
| (1) | 1470000, 113000, 6320, 1200 | 120 |
| (2) | 3730000, 778000, 19800, 3090, 580 | – |
Sample: Dissolved Styrofoam in mobile phase to a concentration of 0.2 (w/v)%
Keywords
GPC, mixed gel, AMR PLgel 10 µm MIXED-B, refractive index detector, Styrofoam
Results
When using one PLgel 10 µm MIXED-B column
Figure 1 shows the chromatograms of the PS standard sample and blank sample (same solvent as the mobile phase) when using one PLgel 10 µm MIXED-B column, and Figure 2 shows the molecular weight calibration curve created using the PS standard sample. PS with a wide range of molecular weights could be successfully separated in about 13 minutes. Additionally, a highly linear calibration curve was obtained.
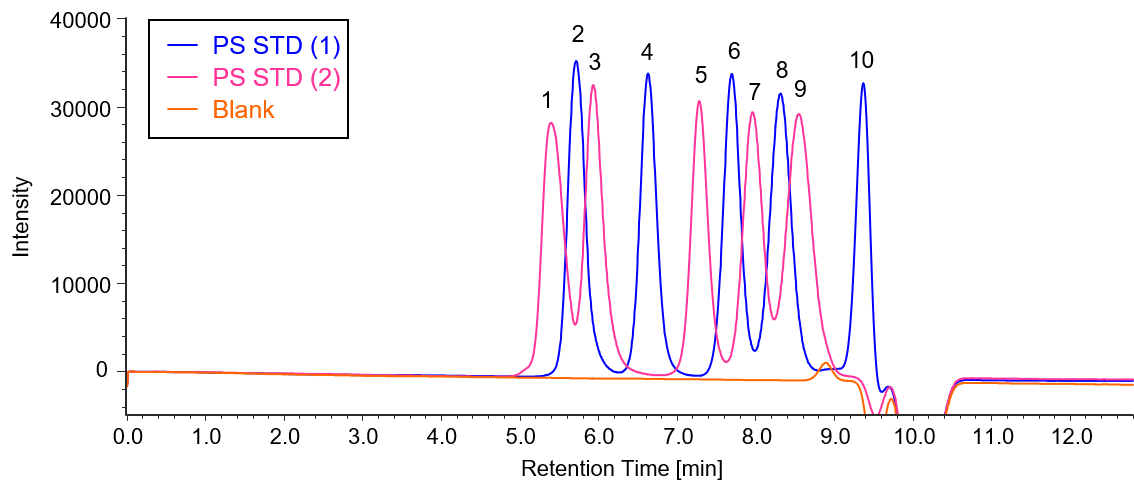
Fig. 1 Chromatograms of the PS standard sample and blank sample
using one PLgel 10 µm MIXED-B column
1: 3730K, 2: 1470K, 3: 778K, 4: 113K, 5: 19.8K, 6: 6320, 7: 3090, 8: 1200, 9: 580, 10: 120
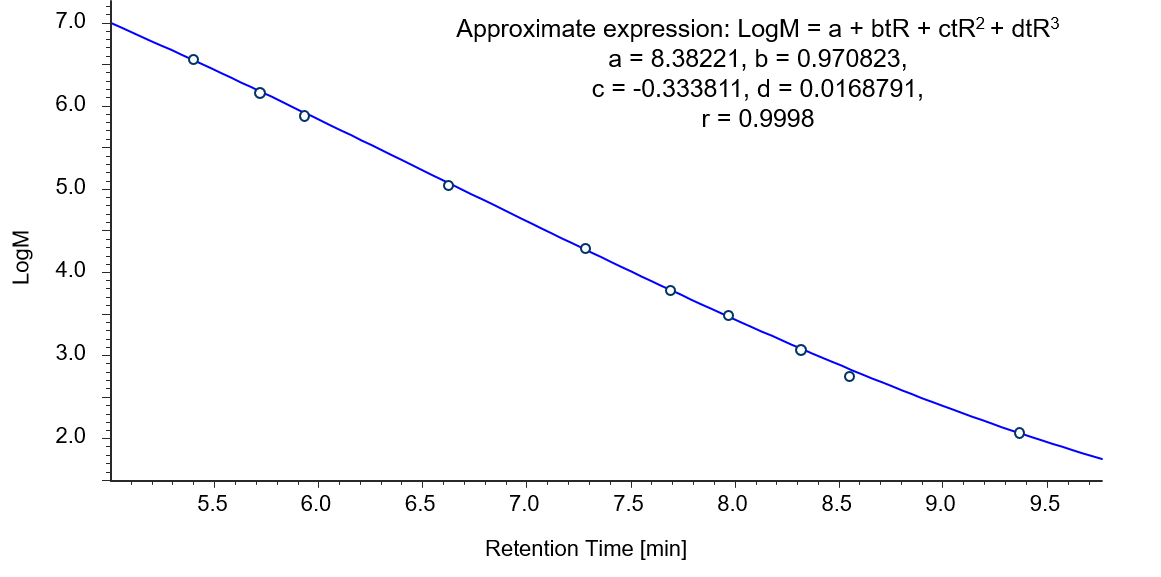
Fig. 2 Molecular weight calibration curve created using the PS standard sample
using one PLgel 10 µm MIXED-B column
Figure 3 shows the chromatogram and calibration curve of Styrofoam using one PLgel 10 µm MIXED-B column, and Figure 4 shows the molecular weight distribution curve.
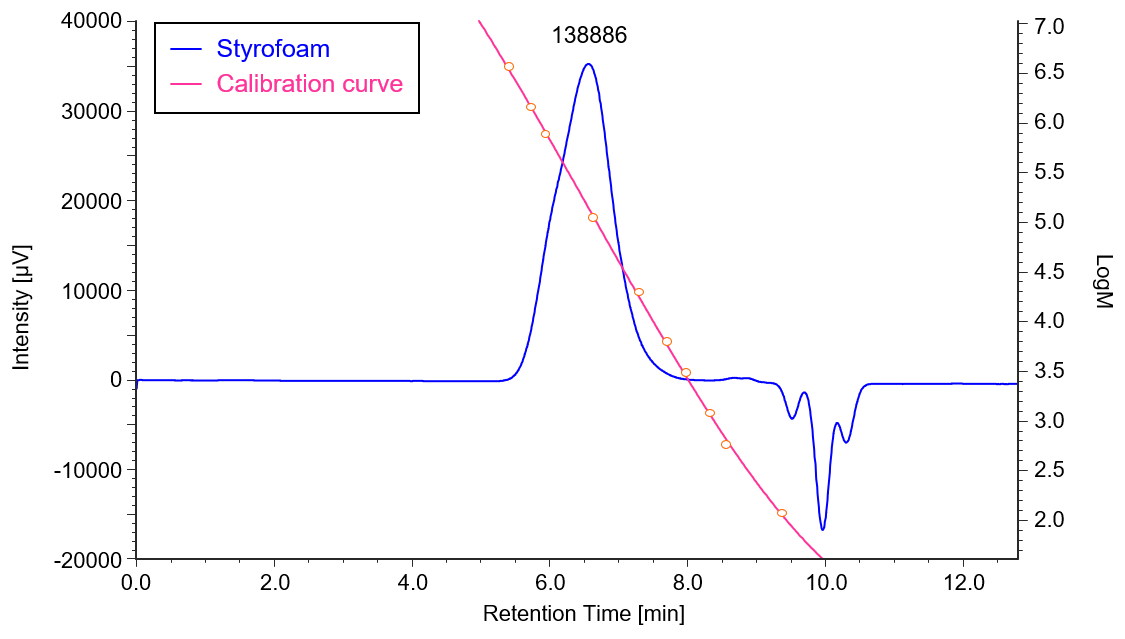
Fig. 3 Chromatogram and calibration curve of Styrofoam
using one PLgel 10 µm MIXED-B column
Numbers on peaks are peak top molecular weight
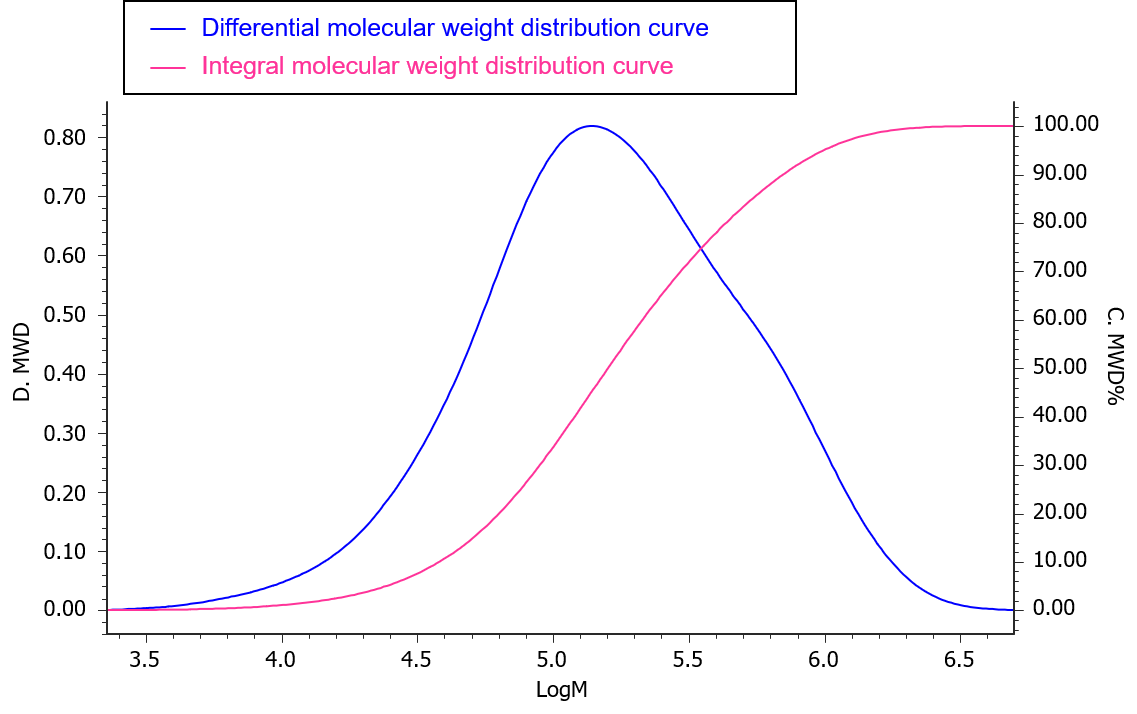
Fig. 4 Molecular weight distribution curve of Styrofoam
using one PLgel 10 µm MIXED-B column
When using two PLgel 10 µm MIXED-B columns connected together
Figure 5 shows the chromatograms of the PS standard sample and blank sample (same solvent as the mobile phase) when using two PLgel 10 µm MIXED-B columns connected together, and Figure 6 shows the molecular weight calibration curve created using the PS standard sample. By connecting two columns, we were able to better separate PS with a wider range of molecular weights than when using one column. Additionally, a highly linear calibration curve was obtained.
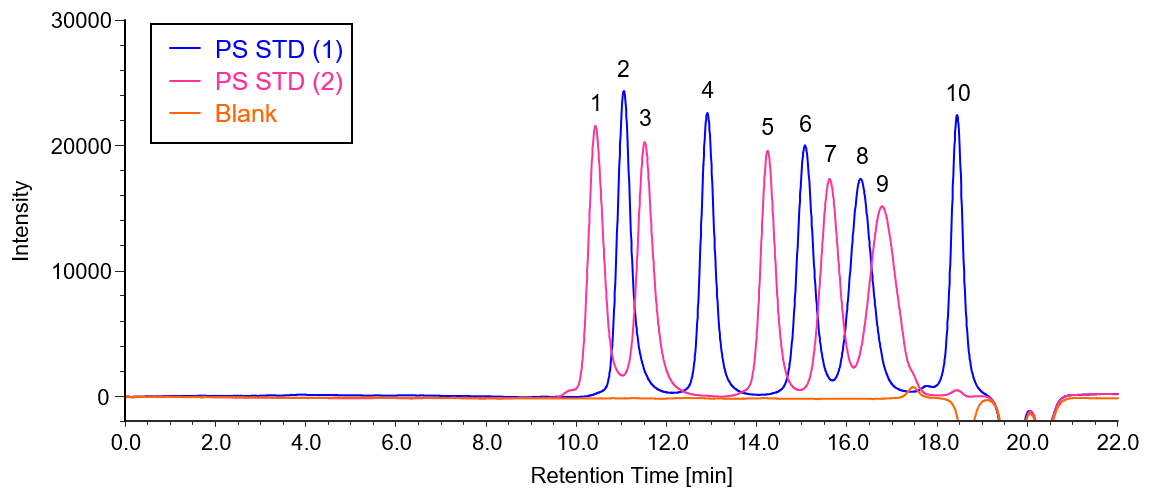
Fig. 5 Chromatograms of the PS standard sample and blank sample
using two PLgel 10 µm MIXED-B columns connected together
1: 3730K, 2: 1470K, 3: 778K, 4: 113K, 5: 19.8K, 6: 6320, 7: 3090, 8: 1200, 9: 580, 10: 120
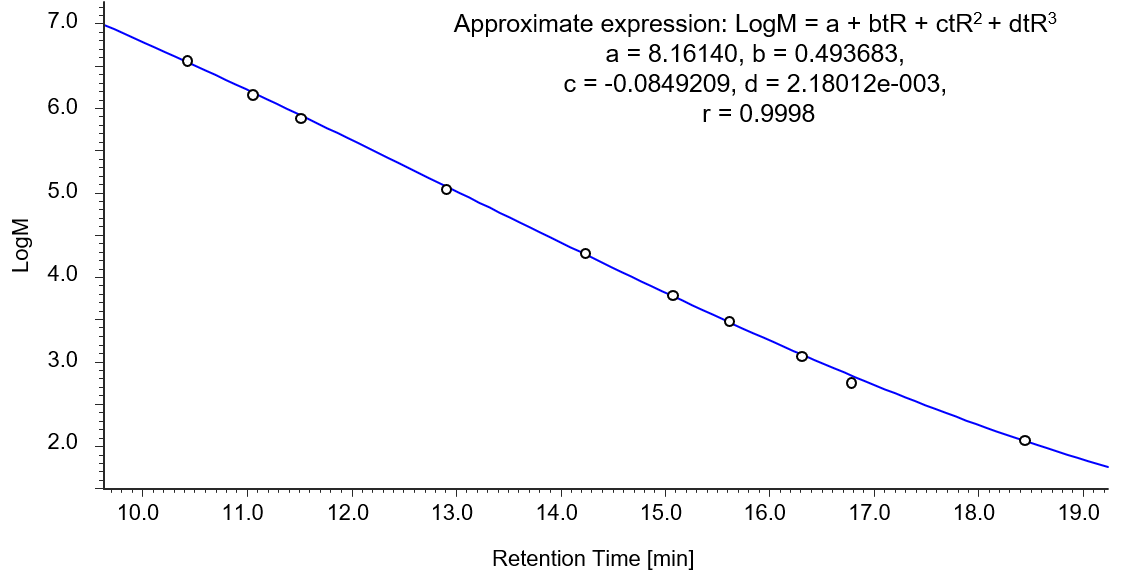
Fig. 6 Molecular weight calibration curve created using the PS standard sample
using two PLgel 10 µm MIXED-B columns connected together
Comparison of using one and two PLgel 10 µm MIXED-B columns
Figure 7 shows the chromatograms of the PS standard sample (2) when using one and two PLgel 10 µm MIXED-B columns, and Table 1 lists the resolution of each peak when using one column and when using two columns. By using two columns, we were able to better separate PS with a wider range of molecular weights than when using one column.
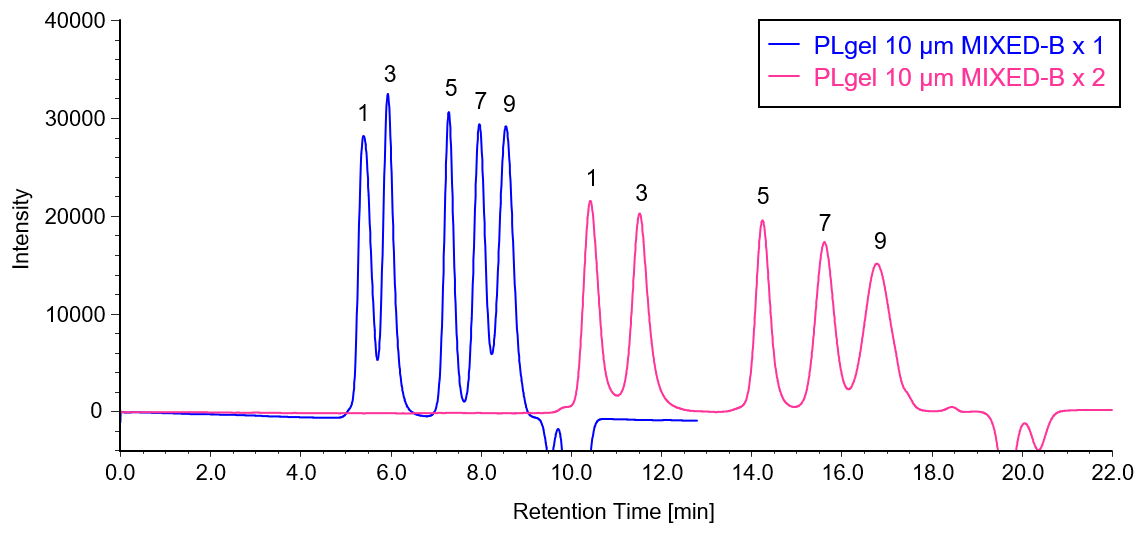
Fig. 7 Chromatograms of the PS standard sample (2)
when using one and two PLgel 10 µm MIXED-B columns
1: 3730K, 3: 778K, 5: 19.8K, 7: 3090, 9: 580
Table 1 List of resolution of each peak when using one column and when using two columns
| Resolution | PS STD (1) | PS STD (2) | ||||||||
| Number of columns | 1470k | 113k | 6320 | 1200 | 120 | 3730k | 778k | 19.8k | 3090 | 580 |
| 1 | 2.26 | 2.67 | 1.37 | 2.52 | – | 1.12 | 3.26 | 1.55 | 1.06 | – |
| 2 | 3.34 | 3.52 | 1.56 | 3.07 | – | 1.71 | 4.41 | 2.01 | 1.22 | – |
Figure 8 shows an overlay of the chromatogram and calibration curve of Styrofoam using two PLgel 10 µm MIXED-B columns connected together, and Figure 9 shows the molecular weight distribution curve. The peak top molecular weight values of Styrofoam under both conditions were relatively similar.
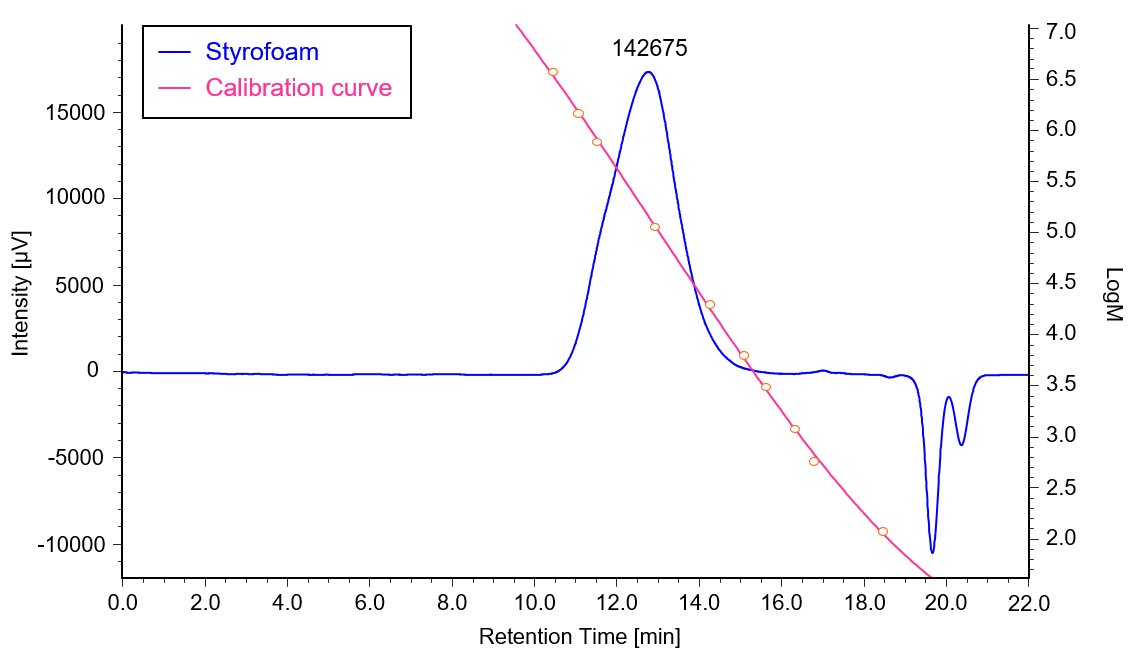
Fig. 8 Chromatogram and calibration curve of Styrofoam
using two PLgel 10 µm MIXED-B columns connected together
Numbers on peaks are peak top molecular weight
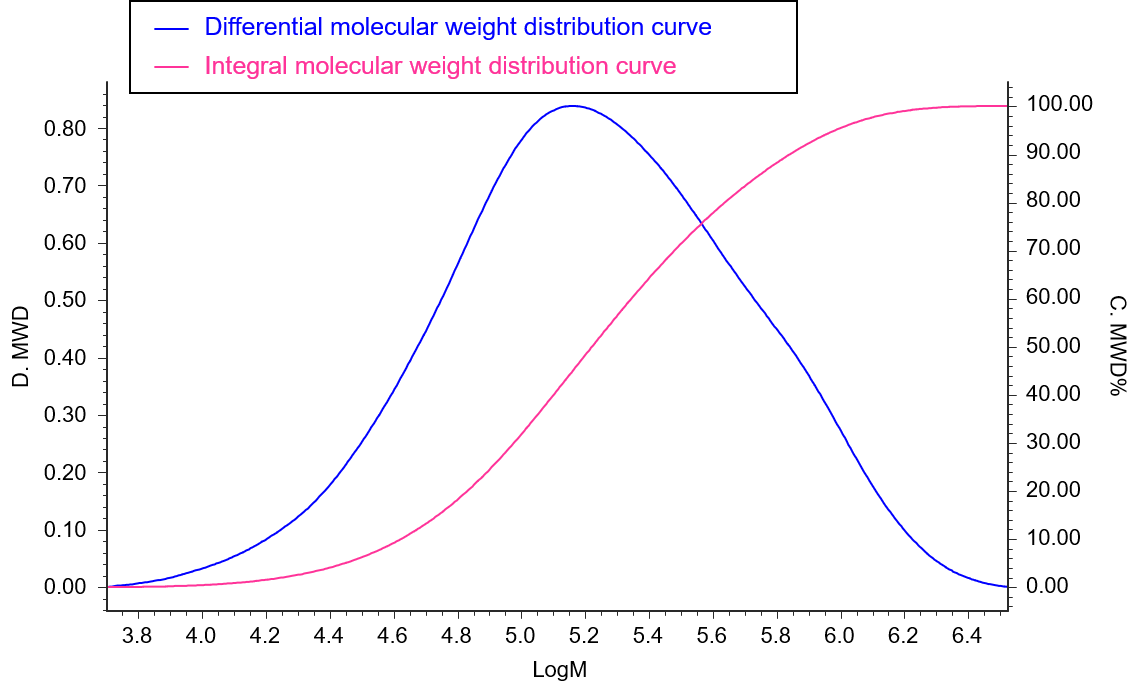
Fig. 9 Molecular weight distribution curve
using two PLgel 10 µm MIXED-B columns connected together
Conclusion
Comparing the results when using one PLgel 10 µm MIXED-B column, which is a mixed gel column, and when two columns are connected, it was shown that there was an advantage in measurement time when using one column, and in separation when using two columns. In addition, we were able to create a good calibration curve under all conditions, and it was shown that there were no major differences in the peak top molecular weights calculated from actual sample measurements.
The column used this time employs macroporous, densely cross-linked polystyrene / divinylbenzene gel, and can be used for analysis at higher temperatures and pressures than conventional columns. In addition, it is resistant to organic solvents at pH 1 to 14 and is resistant to breakdown even when using a wide range of organic solvents from low polarity to high polarity, so it can also be applied to GPC/SEC measurements under these conditions.

