Introduction
CD spectra provide information regarding the secondary and tertiary structure of proteins. While the far-UV region elucidates structural information of the peptide backbone chain, the near-UV region of the spectrum highlights changes involving the aromatic amino acid residues. Therefore, coupling a CD spectrometer with a stopped-flow system is considered one of the best methods for analyzing the unfolding and refolding of proteins. This system now provides not only structural information pertaining to the protein in question, but also supplies this data on a sub millisecond time scale. The user can now obtain a more detailed picture of the time scale for when each protein unfolds and refolds.
This application notes demonstrates the use of the J-1500 CD spectrometer and SFS-492 Stopped-Flow system to monitor the refolding process of cytochrome c.
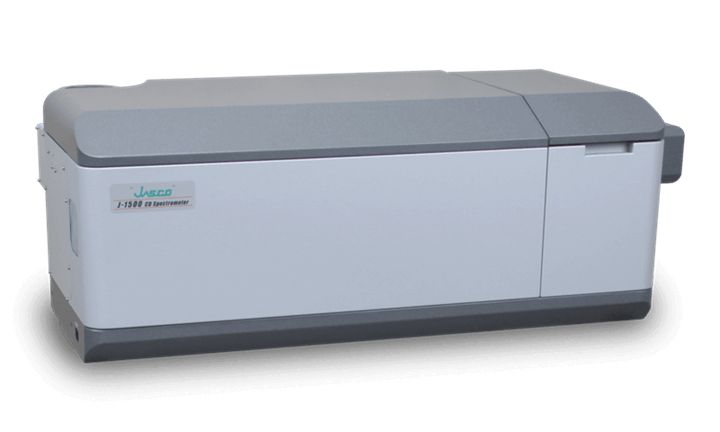
J-1500 CD spectrometer
Experimental
An aqueous solution of cytochrome c denatured by guanidine hydrochloride (GuHCl) was diluted with 0.1 M acetic acid buffer solution (1:9). The refolding process was observed at 222 and 289 nm to monitor the secondary structure changes and aromatic side chain residue environment, respectively.
Measurement conditions (monitoring of secondary structure)
Wavelength: 222 nm
Data acquisition interval: 5 msec
Spectral bandwidth: 4 nm
Response time: 4 msec
Syringe 1: 2 mg/mL cyt c: 4.3 M GuHCl
Syringe 1 loading volume: 30 µL
Syringe 2: 0.1 M acetic acid buffer (pH 6.3)
Syringe 2 loading volume: 270 µL
Accumulations: 36 times
Flow rate: 1.5 mL/sec
Measurement conditions (monitoring of aromatic side chain residue environment)
Wavelength: 289 nm
Data acquisition interval: 10 msec
Spectral bandwidth: 2 nm
Response time: 8 msec
Syringe 1: 10 mg/mL cyt c: 4.3 M GuHCl
Syringe 1 loading volume: 30 µL
Syringe 2: 0.1 M acetic acid buffer (pH 6.3)
Syringe 2 loading volume: 270 µL
Accumulations: 24 times
Flow rate 1.5 mL/sec
Keywords
J-1500, circular dichroism, stopped-flow, SFS-492, protein folding, biochemistry, refolding
Results
The change in the CD value at 222 nm reflects the fast refolding of the secondary structure within 200 msec (Figure 1). The change at 289 nm reflecting the aromatic side chains residue environment was slower than the change at 222 nm (Figure 2). This slower change appears in the latter step of the refolding process, which indicates the brief existence of an intermediate state with a refolded secondary structure and unfolded aromatic side chain residues.
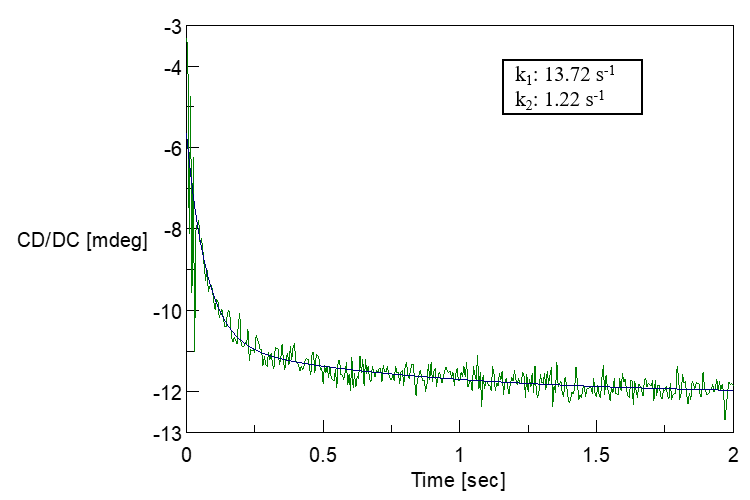
Figure 1. Refolding measurement of cytochrome c monitored at 222 nm
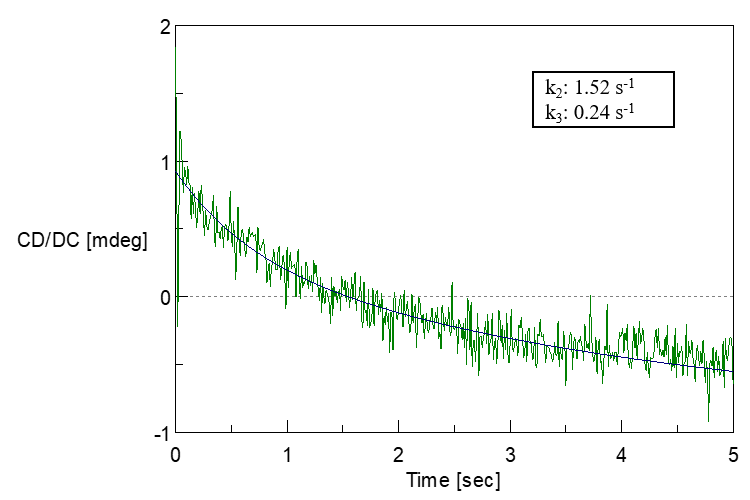
Figure 2. Refolding measurement of cytochrome c monitored at 289 nm
Conclusion
This application note monitors the existence of an intermediate state by probing the refolding of denatured cytochrome c using a JASCO CD spectrometer and the SFS-492 Stopped-Flow system.
References
1. Elove, G. A., Chaffotte, A. F., Roder, H., and M. E. Goldberg, Biochemistry (1992), 31, 6876.
2. Chaffotte, A. F., Guillou, Y., and M. E. Goldberg, Biochemistry (1992), 31, 9694.
Related Posts:
 Reaction Monitoring System using Surface-Enhanced…
 In-situ Raman Monitoring for Flow Synthesis of Peptide Drugs
 Measurement of alanine powder using DRCD with…
 Analysis of CBN-Binding DNA Aptamer using CD Spectroscopy") Higher-Order Structure (HOS) Analysis of CBN-Binding…
Higher-Order Structure (HOS) Analysis of CBN-Binding… Higher Order Structure, Stability, and Similarity…
 Microplastics Identification using Macro-ATR Unit…