Introduction
It is important to know the components (or ingredients) in foods to solve the problems on the manufacturing process and quality control, and IR spectroscopy is effective tool to get such information. However, since many ingredients are included in food, IR spectrum which these information is added in is detected, and it is hard to extract the information which the user needs. In order to get the proper data from measurement data, chemometrics is used frequently. Examples of chemometrics technique are the principal component analysis (PCA) and the partial least squares (PLS) regression.
PCA is the technique that can perform the dimensionality reduction of the data during minimizing the information loss of high-dimensional data (such as spectra). Its technique enables to find the characteristics (latent variables) from multi-data (spectra), which can perform the identification and classification of data.
Although PLS regression can also perform the dimentionality reduction like PCA, it is the regression analysis utilizing the latent variables, which are found so that the relation (covariance) between the latent variable and the response variable is maximized. Its technique can create the robuster model than the general multiple regression analysis, and it is strong against the noise.
This article shows the quantitative analysis result of protein in food product by PLS. Measurement data were acquired by IR spectroscopy for these analyses.
FT/IR-4600 FTIR spectrometer
Results
The several food samples including the protein (table 1) were measured by IR spectroscopy.
Table 1. Food samples and their protein concentration (on label)
| Food sample | Protein concentration |
| Gouda cheese | 18.0 % |
| Natural cheese | 28.0 % |
| Worcester sauce | 0.9 % |
| Yogurt | 4.2 % |
| Soybean milk yogurt | 4.0 % |
| Miso (salted bean-paste) | 10.0 % |
Figure 1 shows the near-IR spectra of them. Although these spectra are similar, there are slight difference among them.
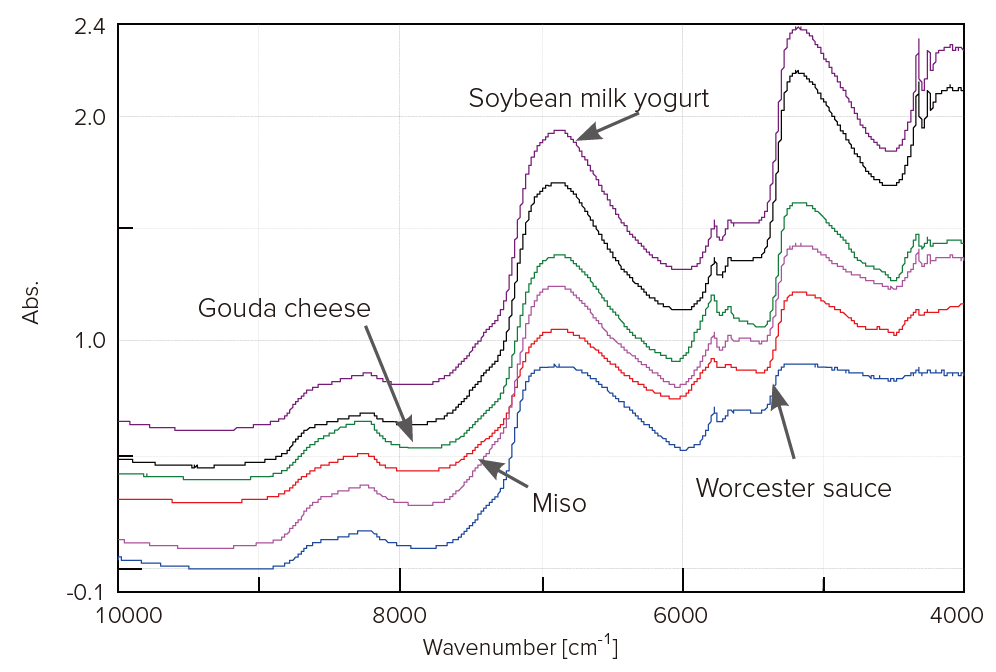
Figure 1. Near-IR spectra of food samples
Next, PLS calibration model were created by using the measured data and the protein concentration value which is described on the label of each food sample (table 1). Figure 2 shows the correlation between the spectrum and protein concentration. Its correlation coefficient was 0.994, which means that it is good calibration model.
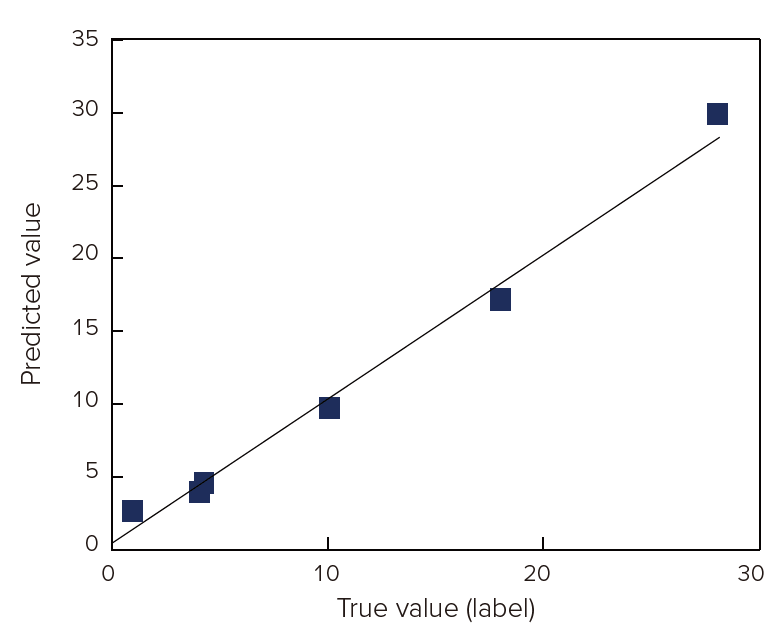
Figure 2. PLS calibration model of protein
Related Posts:
 Application eBook - Food and Beverage Science
 Analysis of Carbon Products using Raman Spectroscopy
 Monitoring of Aggregates and Degradation Products by…
 Analysis of pollen collected by Durham sampler…
 Base Material and Dye Analysis - Combined Raman and…
 Combined Analysis of Thermochromic Materials -FT-IR…