Introduction
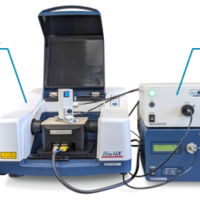
One drop attachment is a microsampling accessory that enables fluorescence measurements to be obtained with only 5 μL of sample. It is the most suitable and effective for quantitative analysis of multiple samples such as fluorescently-labeled DNA and various kinds of fluorescent dye.
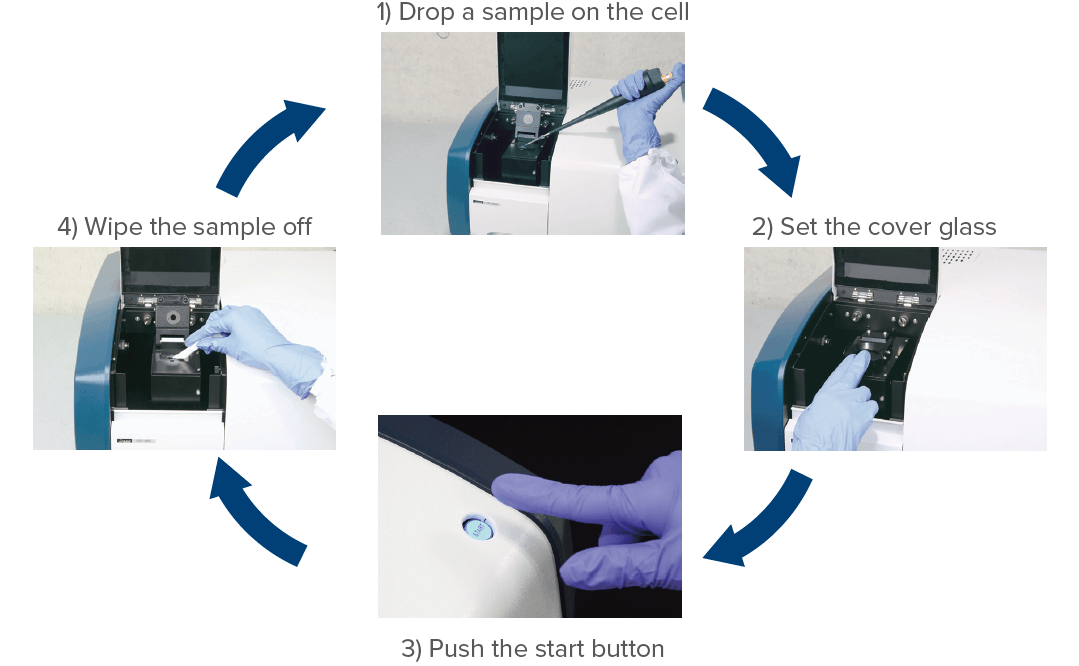
This section demonstrates the use of the One Drop accessory to obtain fluorescence data and create a calibration curve of λDNA labeled with PicoGreen®.
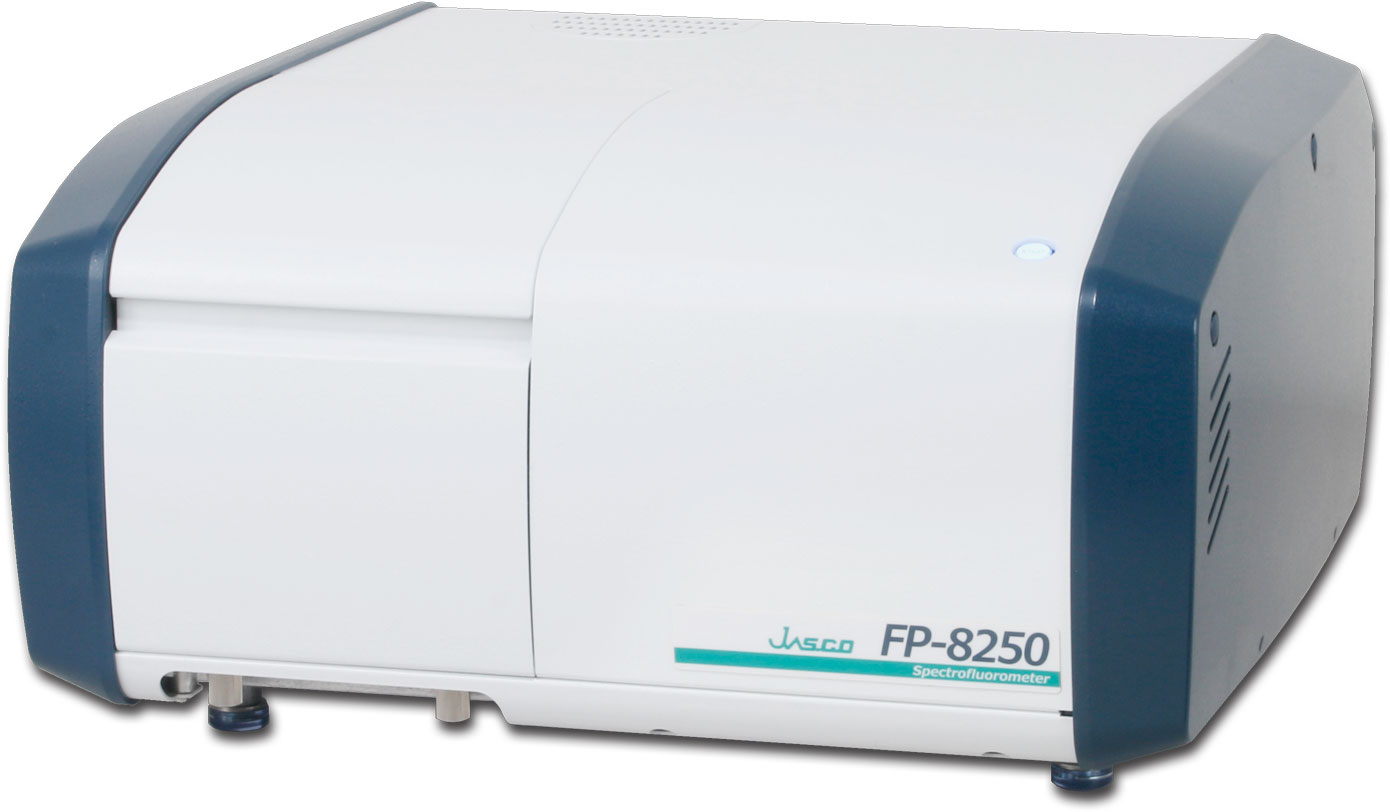
FP-8250 Spectrofluorometer
Keywords
One Drop, nucleic acid, reproducibility, linearity
Results
The fluorescence spectra of λDNA for a variety of concentrations is shown in Figure 1, and indicates that the maximum emission wavelength is 523 nm.
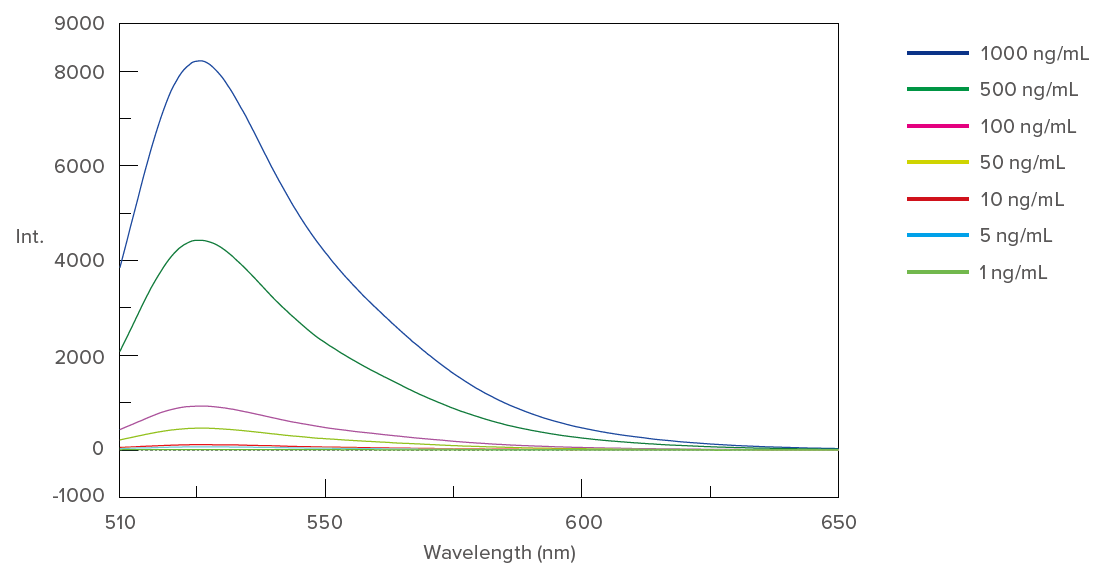
Figure 1. Fluorescence spectra of λDNA labeled with PicoGreen®
The fluorescence intensity at the maximum emission wavelength (523 nm) was then measured five times for each sample to ensure measurement reproducibility. Table 1 shows these measurement reproducibility results
for each sample concentration.
Table 1. Measurement reproducibility results
| Conc. (ng/mL) | 1 | 2 | 3 | 4 | 5 | Ave. | S.D. | C.V.(%) |
| 0 | 53.3 | 52.4 | 55.9 | 53.1 | 55.2 | 54.0 | 1.49 | 2.8 |
| 1 | 63.6 | 68.1 | 65.9 | 66.5 | 65.1 | 65.8 | 1.68 | 2.6 |
| 5 | 110.3 | 106.7 | 105.1 | 104.0 | 110.0 | 107.2 | 2.86 | 2.7 |
| 10 | 157.6 | 155.5 | 156.1 | 153.0 | 151.7 | 154.8 | 2.39 | 1.5 |
| 50 | 447.1 | 465.3 | 460.2 | 455.8 | 469.0 | 459.5 | 8.56 | 1.9 |
| 100 | 865.9 | 856.9 | 848.3 | 850.6 | 853.9 | 855.1 | 6.86 | 0.8 |
| 500 | 3842.7 | 3831.0 | 3858.0 | 3828.9 | 3811.0 | 3834.3 | 17.42 | 0.5 |
| 1000 | 7766.2 | 7992.1 | 7925.3 | 7972.8 | 7805.7 | 7892.4 | 101.15 | 1.3 |
[Measurement parameters]
Measurement mode: Emission
Excitation wavelength: 480 nm
Emission wavelength: 523 nm
Bandwidth (excitation): 20 nm
Bandwidth (emission): 20 nm
Response: 1 sec.
Sensitivity: 620 V
A calibration curve was then created using the average value for each concentration from the reproducibility results in Table 1 and is shown in Figure 2. The correlation coefficient is 0.9999 and the standard error is 6.819, indicating a good fit.
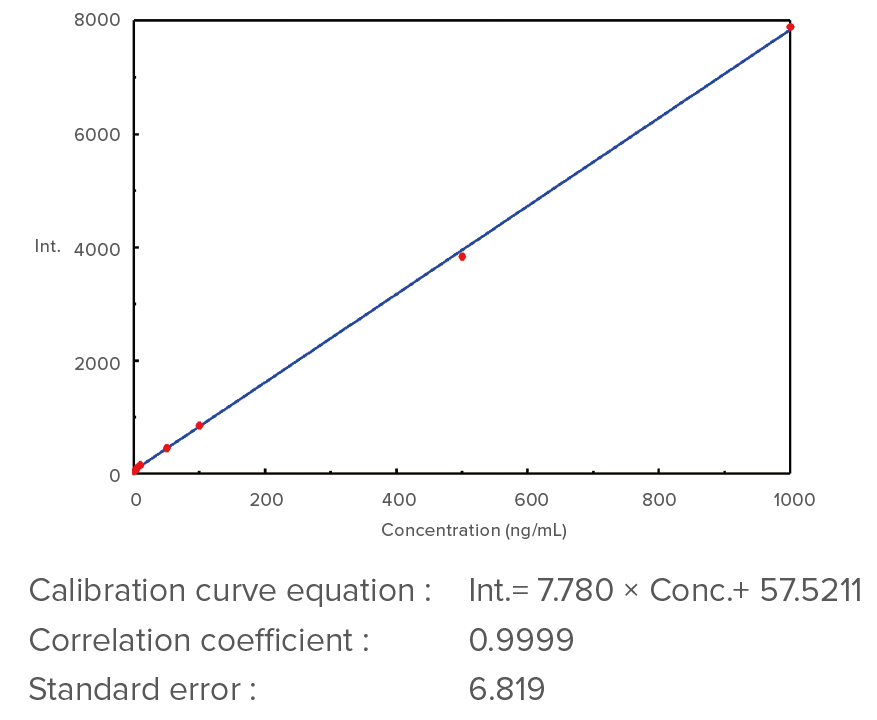
Figure 2. Calibration curve of λDNA labeled with PicoGreen®

