Introduction
Mapping measurements using an FT-IR microscope used to be difficult due to requirements of extensive sample preparation and long measurement times. Now, the sample can be easily treated by using a tool like the SliceMaster sample preparation accessory and the measurement can be performed at a much faster rate using a multi-element detector for rapid sample imaging. However, although the mapping measurement itself can be performed easily, data analysis can be complicated due to the high number of data points. This article outlines an example of PCA mapping which enables a rapid and easy component distribution analysis of the obtained sample mapping data.
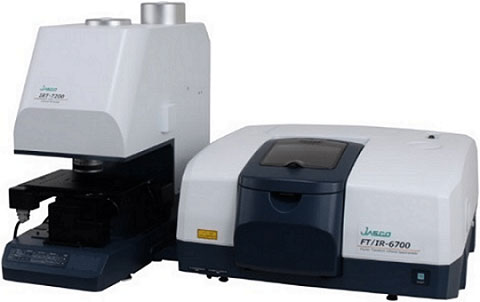
FTIR spectrometer with IR microscope (FT/IR-6700 + IRT-7200)
Experimental
A portion of an LCD color monitor, as displayed in Figure 1, was used as a sample.
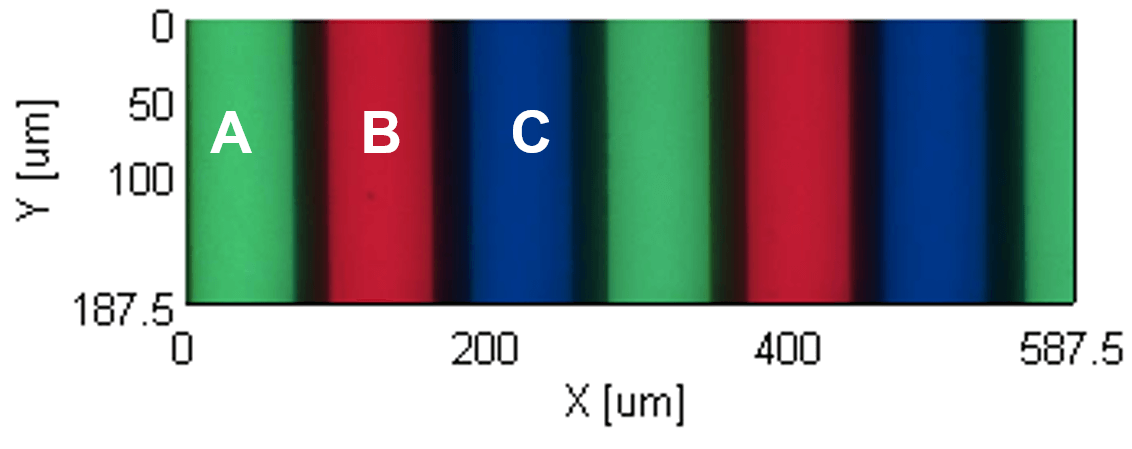
Figure 1. LCD color monitor (observation image of the measurement area)
Measurement conditions
Detector: Linear array MCT detector
Resolution: 8 cm-1
Accumulations: 64
Method: Transmittance
Measurement time: approximately 7 minutes
Measurement area: 587.5 x 187.5 µm (48×16 points)
Results
Each spectrum obtained at the marked positions of A, B and C in Figure 1 are displayed in Figure 2. Since the spectra of A, B and C are quite similar and the identification of A and C are especially difficult.
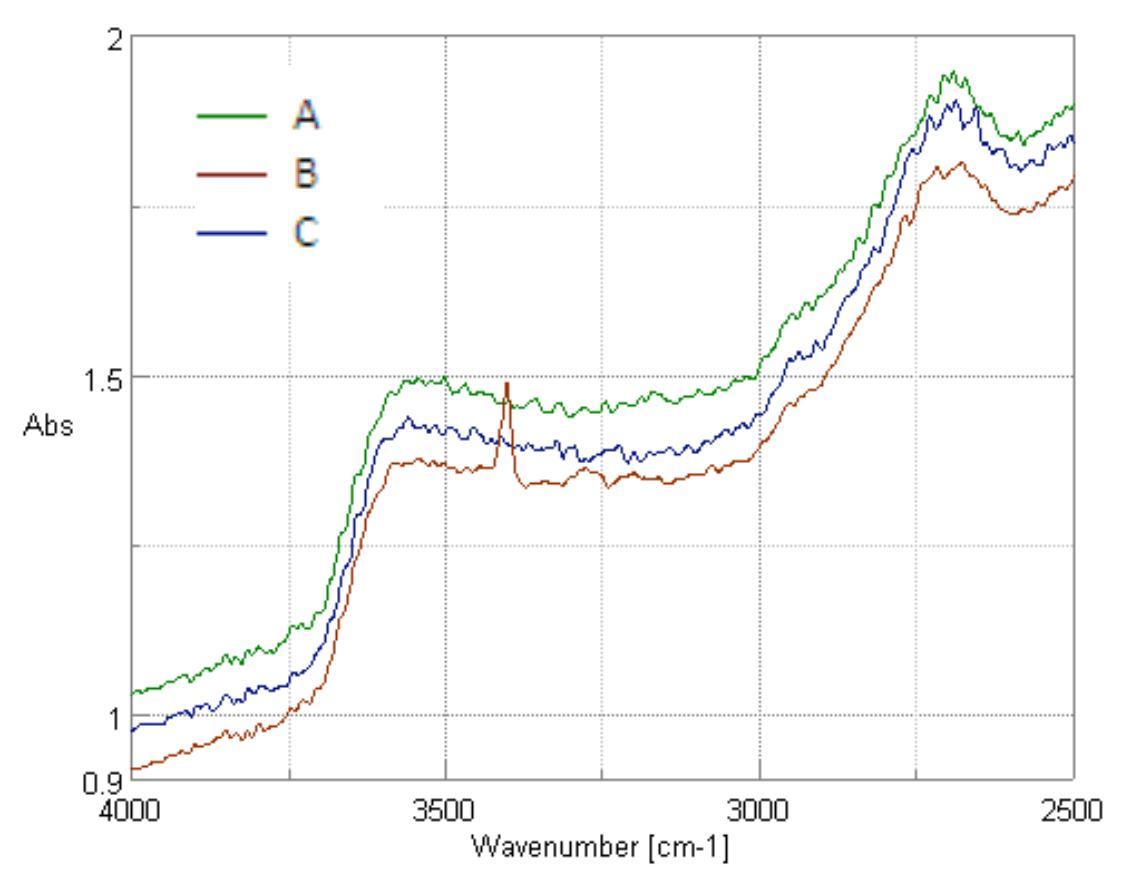
Figure 2. LCD measurement spectra
The spectra of the main components obtained by the principal component analysis are shown as Figure 3.
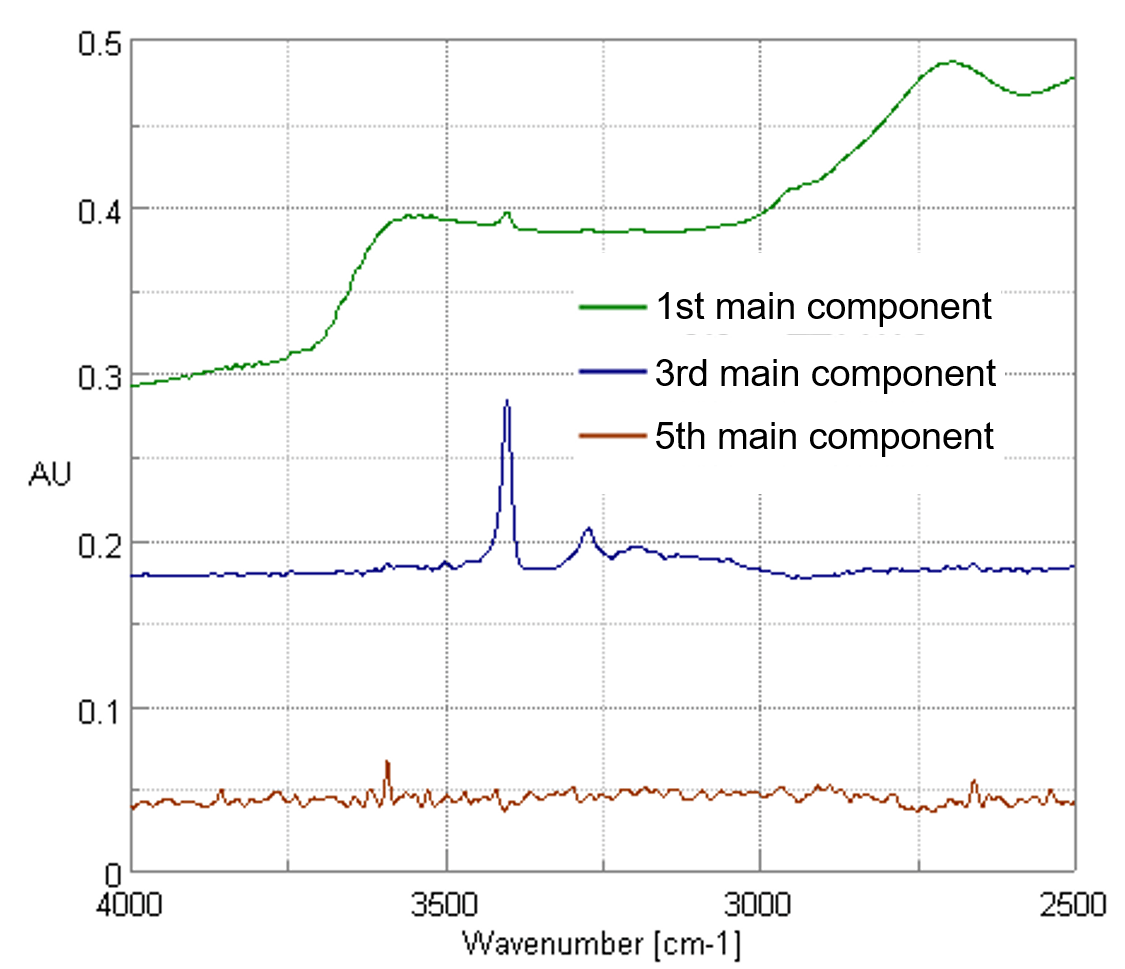
Figure 3. Principal component spectra
The spectrum of glass is first main component among A, B and C in common. The peaks of the red pigment from B are observed as the third main component and some very small peaks of A, B and C, difficult to recognize, can be seen as the fifth main component. In this analysis, the third and fifth main components represent the specific peaks for each main component and the identification of the components were attempted by plotting the score value of the third and fifth main components as shown in Figure 4.
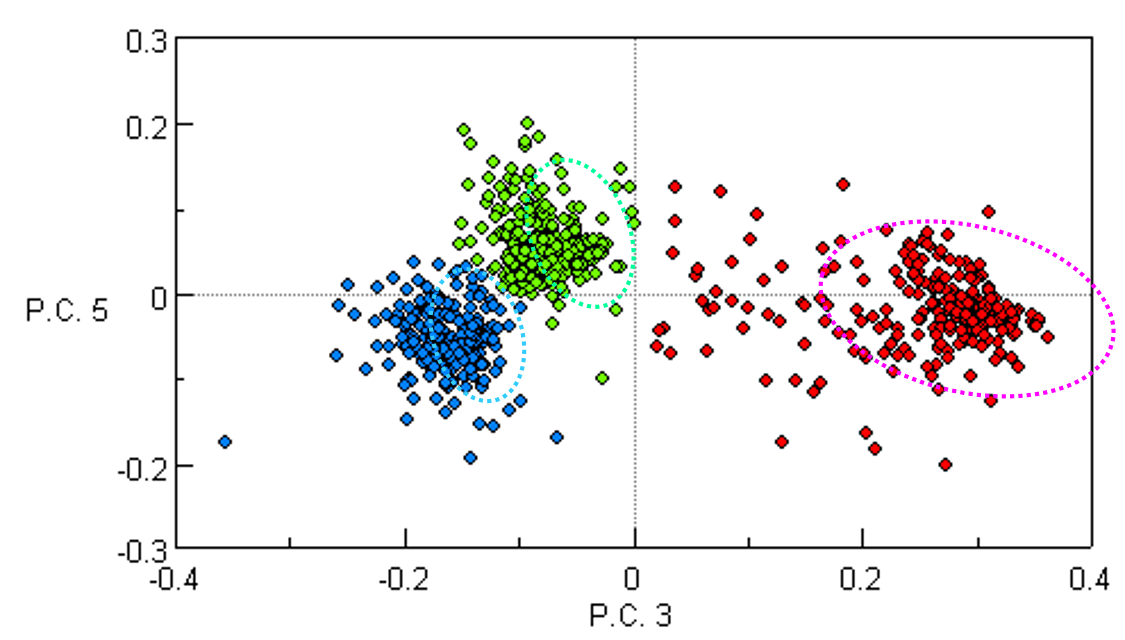
Figure 4. The plot of the score values for the third and fifth main components
The areas surrounded with dotted lines in Figure 4 highlight the plotted values of the score for the third and fifth main components, and are grouped in 3 main areas. In the PCA mapping software, setting the color coding of each group from the plot values on the graph in Figure 4 provides a color diagram as shown in Figure 5.
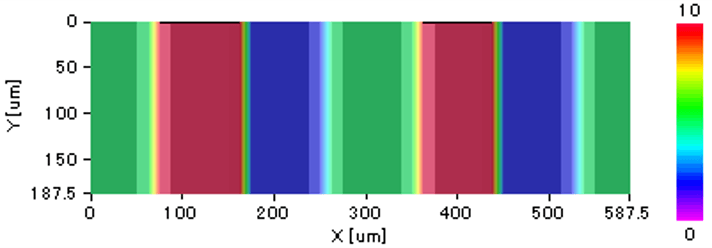
Figure 5. Color diagram of the PCA grouping results
Conclusion
The principal component analysis can be a useful tool because specific peaks contained in the data can be extracted and the compositional distribution is simply analyzed by the component grouping, even for measurement results that are seemingly difficult to identify from the individual component spectra.
Related Posts:
 Structural Analysis of Chiral Samples with Multiple…
 Analysis of pollen collected by Durham sampler…
 Base Material and Dye Analysis - Combined Raman and…
 Combined Analysis of Thermochromic Materials -FT-IR…
 Analysis of Water-soluble Vitamins by…
 Analysis of Ultraviolet Absorbers in Sunscreen Cream by HPLC