Introduction
Various FTIR methods for identifying a foreign material or contaminant exist such as infrared microscopy when the particle size is on the order of few microns. When the target can be confirmed visually it is typically on the order of several hundred microns and does not require an infrared microscope. A macro ATR method is a suitable alternative and offers advantages such as: no sample preparation, non-destructive, and easy-handling.
One of the important point of the ATR measurement is the intimate contact between the sample and the ATR crystal. In the case of a conventional ATR accessory, the user cannot ensure where the sample is contacting the crystal making it difficult to know whether contact is with the bulk sample or with the foreign contaminant.
JASCO’s latest FTIR accessory, ATR PRO 4X VIEW, can provide a direct visualization of the sample area in contact with the ATR crystal. This feature is quite effective to measure foreign materials on opaque substrate (paper, plastic, metal, etc.).
This application note shows the example of foreign material analysis using the ATR PRO 4X VIEW.
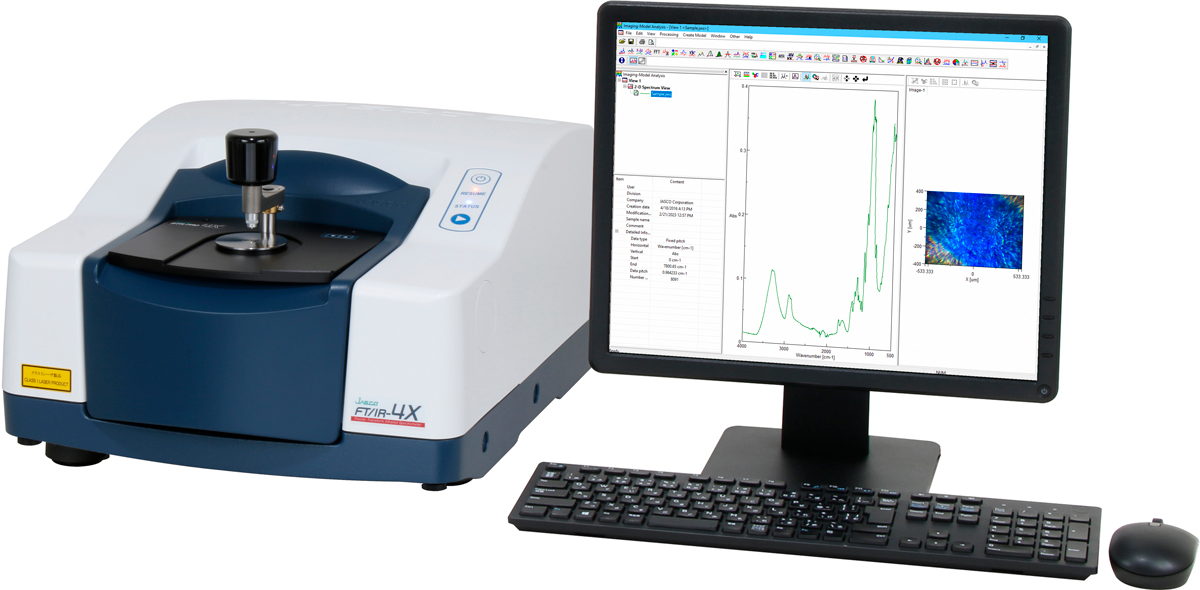
FT/IR-4X with ATR PRO 4X VIEW
Experimental
Sample
Foreign material on paper
Measurement parameters
Instrument: FT/IR-4X
Measurement Method: ATR
Accessories: ATR PRO 4X VIEW
Detector: DLATGS
Crystal: Diamond
Accumulation: 50
Resolution: 4cm-1
Figure 2 (left) shows the picture of the sample. Figure 2 (right) shows the observation image of the target contacted with crystal. As shown in Figure 2, ATR PRO 4X VIEW can hold the target on the crystal properly.
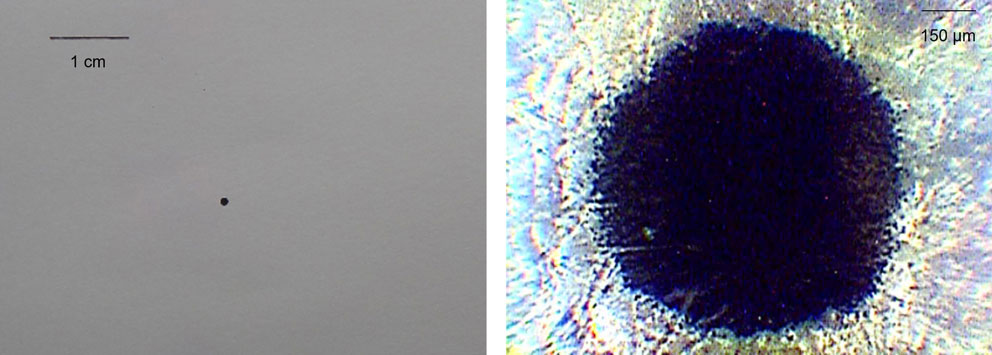
Figure 2. Picture of foreign material on paper (left) and 3 Sample observation image by using ATR PRO 4X VIEW (right)
Results
Figure 4 shows the spectra of paper and foreign material on paper.
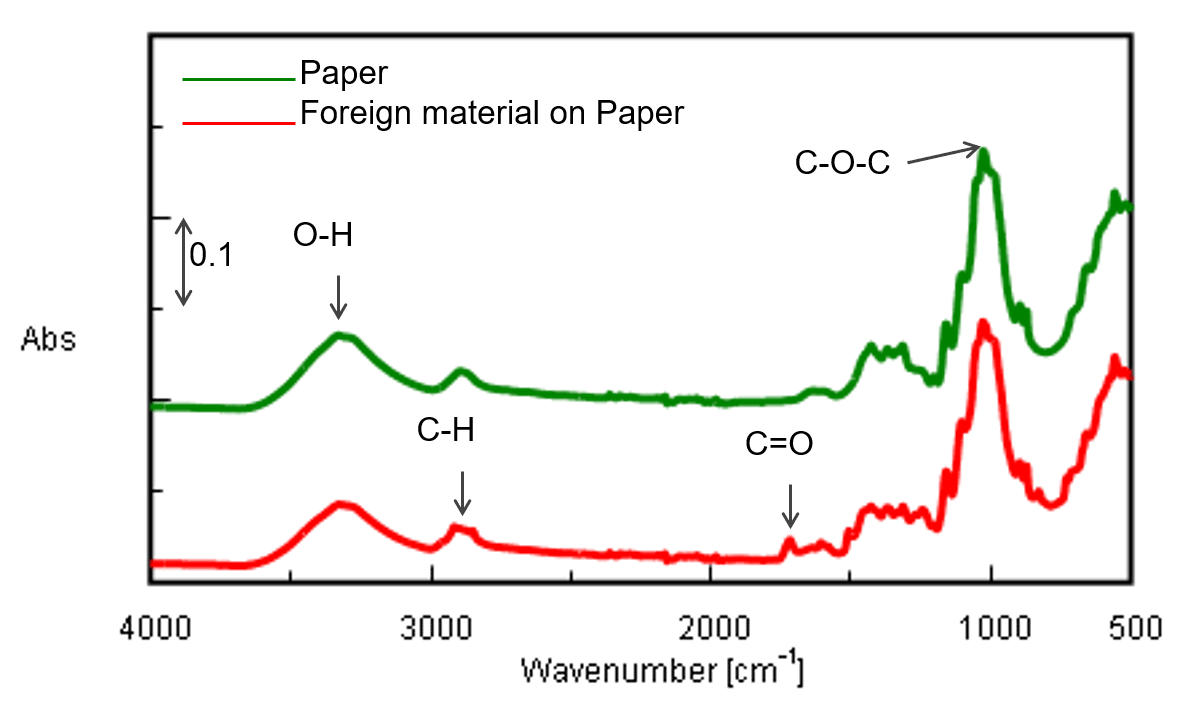
Figure 4 Spectra of paper (upper) and foreign material attached paper (lower)
*vertical axis is offset.
From the upper spectrum, O-H peak (around 3300cm-1) and C-O-C peak (around 1000 cm-1) are confirmed indicating the main component is cellulose. From the lower spectrum, the peaks ascribed to cellulose, C-H peak (around 2900 cm-1) and C=O peak (around 1720 cm-1) are confirmed.
In order to identify the foreign material, the subtraction spectrum was calculated and searched through a spectral database identifying the foreign material as a polyester.
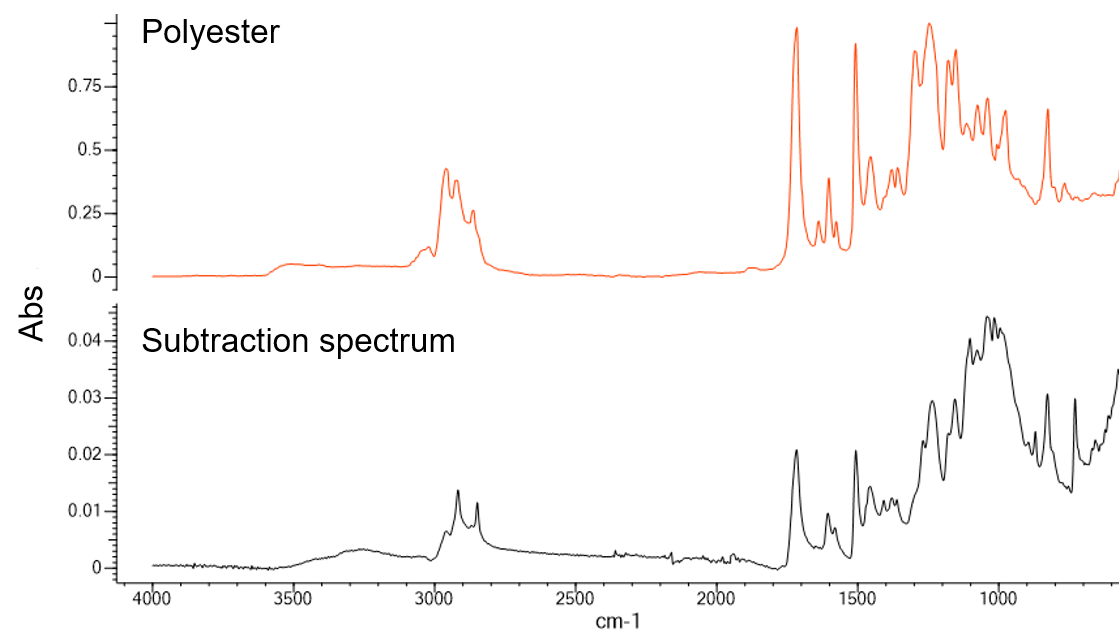
Figure 5. Database search result of subtraction spectra
Related Posts:
 Fluorescence Observation and Foreign Materials…
 Base Material and Dye Analysis - Combined Raman and…
 Microplastics Identification using Macro-ATR Unit…
 Combined Analysis of Thermochromic Materials -FT-IR…
 Analysis of CBN-Binding DNA Aptamer using CD Spectroscopy") Higher-Order Structure (HOS) Analysis of CBN-Binding…
Higher-Order Structure (HOS) Analysis of CBN-Binding… Analysis of Styrofoam by GPC/SEC using mixed gel column