Introduction
In deliciousness of food, texture is one of the important factors. The texture is affected by the amount and the existence state of contained ingredients. In particular, it is thought that the feeling at the moment when putting into the mouth is greatly affected by the component distribution state of the product surface. Therefore, by appropriately evaluating its component distribution state, there is a possibility to obtain effective information on deliciousness.
In order to properly evaluate the surface condition, non contact measurement without sampling is required to prevent the component distribution change. Raman spectroscopy is one of the few measurement methods that can fulfill this requirement. Since Raman spectroscopy measures scattered light, measurement can be performed basically by simply placing the sample.
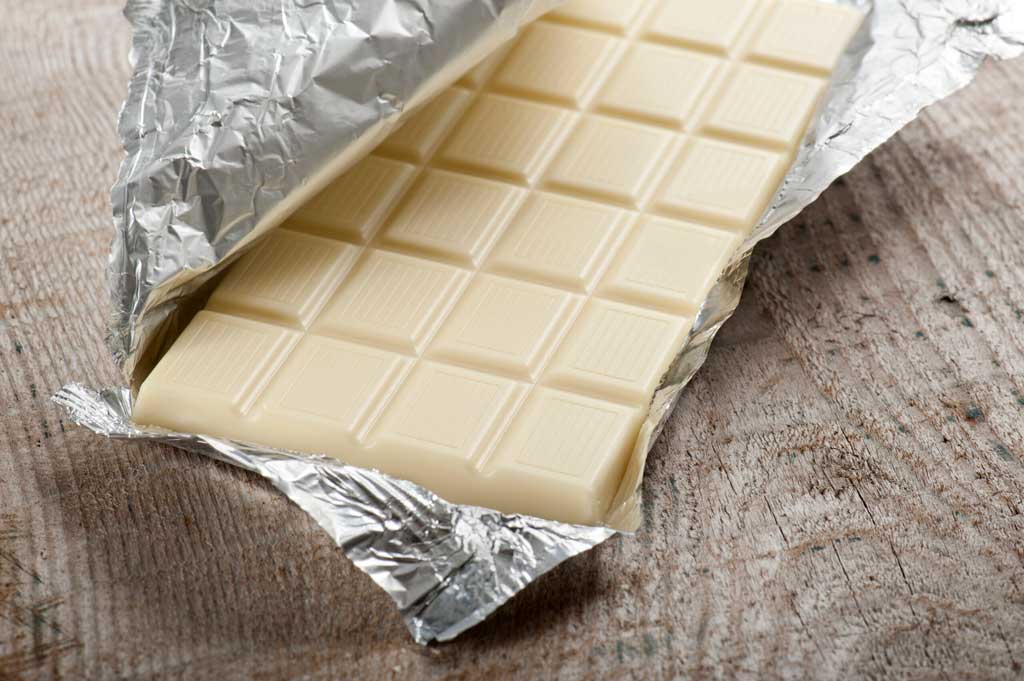
In this article, the surface condition of commercially available white chocolates were evaluated with a microscopic Raman spectrophotometer. The comparison of the surface distribution of the two white chocolates surface and the change of the surface condition by heating (reproduction of fat bloom*) were reported.
*Fat Bloom is a phenomenon in which the color appears to change due to phase separation and nonuniformity of components in chocolate by the behavior of oils and fats.
Experimental
Two kinds of white chocolates (white chocolate A, B) were respectively fixed on the slide glass and imaging measurement was performed. For white chocolate A, the surface was melted with a hair drier, and the imaging measurement was performed in the same way.
Measurement parameters
Excitation wavelength: 532 nm
Objective lens: 100x (long working distance type)
Interval: 2 µm
Measurement points: 51 x 51 (100 x 100 µm)
Exposure time: 0.03 second
Measurement time: Approx. 100 seconds
*In order to suppress denaturation of samples, a high-speed imaging function QRI (Quick Raman Imaging) was used, and laser irradiation time was minimized.
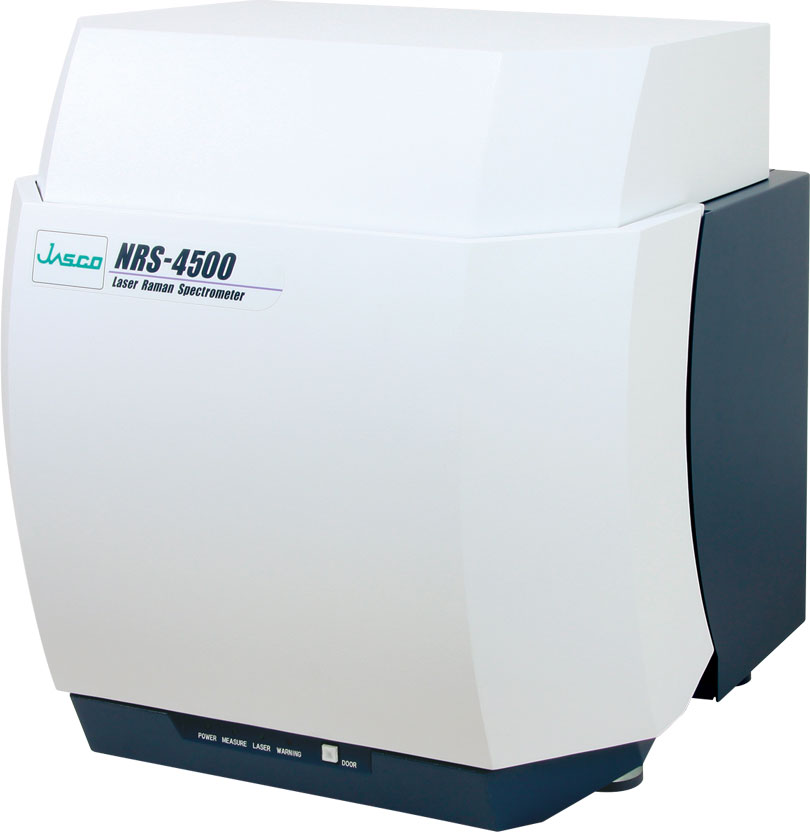
Figure 1. Raman spectrometer (NRS-4500)
Results
Figures 2 and 3 show the microscopic images of the white chocolate measurement section, the spectra of oils and sugars obtained by MCR model analysis, and chemical images obtained by plotting the respective components with scores. Sugar is scattered in oils and fats in both chemical images. It is said that fats and oils of chocolate exist as a continuous phase, and this result proves it.
The comparison of surface distribution states of two white chocolates (Figure 2)
Comparing the surface distributions of oils and fats and sugar in white chocolate A and B, it was found that oils and fats was exposed on the surface of A, and sugar was exposed on the surface of B. Due to these differences, it is expected that A melts wellin the mouth, and strong sweetness is felt at the moment of putting B in the mouth. As a result of actually eating, I got such a feeling.
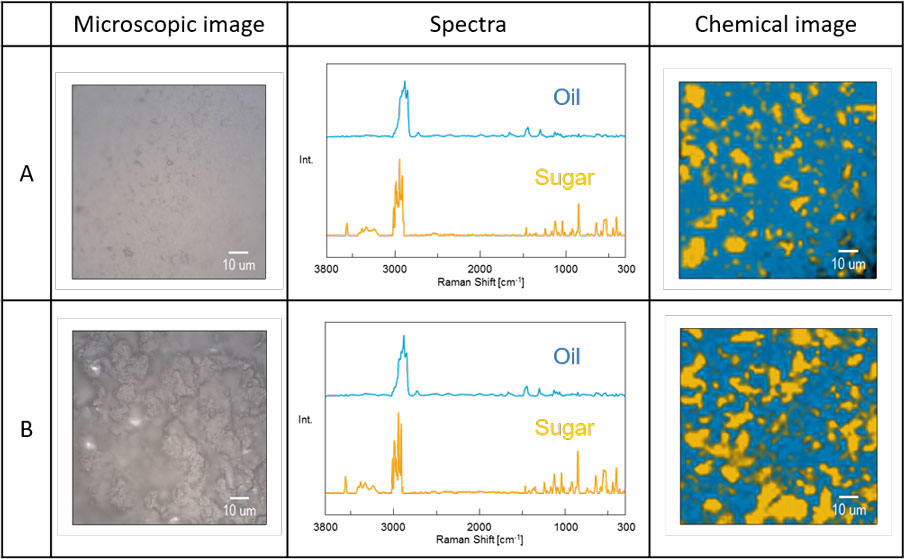
Figure 2. Measurement results of two kinds of white chocolates (A, B)
Changes in surface condition due to heating of white chocolate A (Figure 3)
It was found that exposure of fats and oils became noticeable by applying heat. Fats and oils having a lower melting point than sugar are fluid to heat, this time the state change was able to be captured.
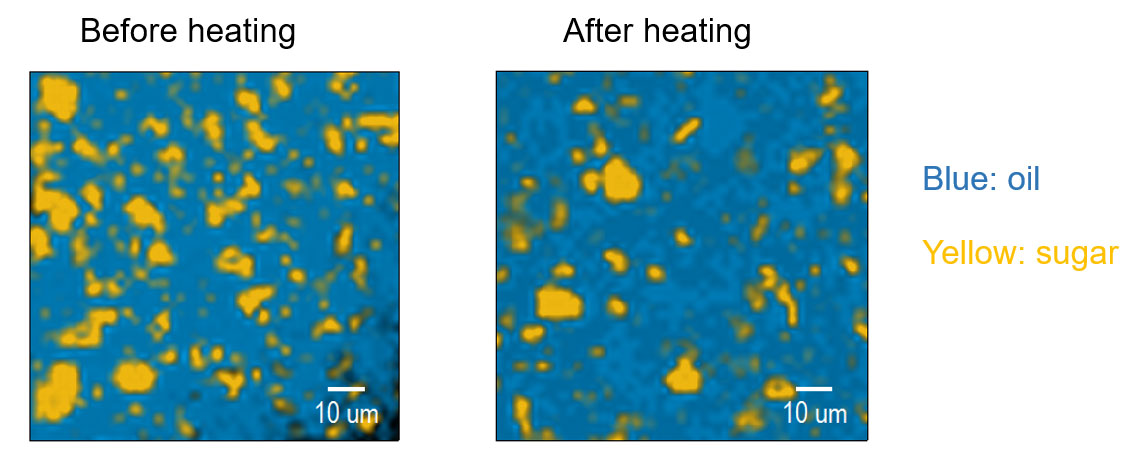
Figure 3. Measurement results before and after heating of white chocolate A
Conclusion
It was found that by using the high-speed imaging function of the microscopic Raman spectrophotometer which can measure samples non-destructively and noncontactly, the component distribution state on the micron order can be evaluated without changing the surface condition.
In addition to chocolate, this technique is particularly effective in evaluating soft materials such as butter and margarine, biological samples, etc., whose state of the target ingredient changes due to pressurization during sampling or measurement.
References
Special thanks to Kinta Yasuyoshi of Morinaga & Co., Ltd. who advised to this research.
Related Posts:
 Evaluation of Reflectance of Microlens Surface using…
 Evaluation of Degradation of PET by Molecular Weight…
 Evaluation of Degradation of POM by Molecular Weight…
 Evaluation of Degradation of PA6 by Molecular Weight…
 Degradation by Molecular Weight Distribution Measurements") Evaluation of Polystyrene (PS) Degradation by…
Evaluation of Polystyrene (PS) Degradation by… Degradation by Molecular Weight Distribution Measurements") Evaluation of Polycarbonate (PC) Degradation by…
Evaluation of Polycarbonate (PC) Degradation by…