Introduction
Along with NMR and X-ray crystallography, CD spectroscopy is an indispensable measurement method for protein structure analysis. Since small volumes and/or low concentrations are a typical requirement for CD sample measurements, JASCO has developed a novel sampling technique to meet these sample requirements.
The technique uses a One-Drop microsampling disc (MSD), which is shown in Figure 1. CD measurements using the One-Drop MSD have the following advantages:
- Small volume requirements: 10 µL (1 mm path length), 2µL (0.2 mm path length)
- Easy handling of MSD: hydrophobic treatment of lens keeps samples centered in disc
- Variable path length: spacers available for 1 or 0.2 mm path length
- MSD windows provide artifact-free measurements
- JASCO CD spectrometers use a parallel light beam so there is no need for alignment
- Highly reproducible baseline
- This application note will demonstrate the ease and efficiency of the One-Drop microsampling disc by measuring the CD spectra of four proteins.
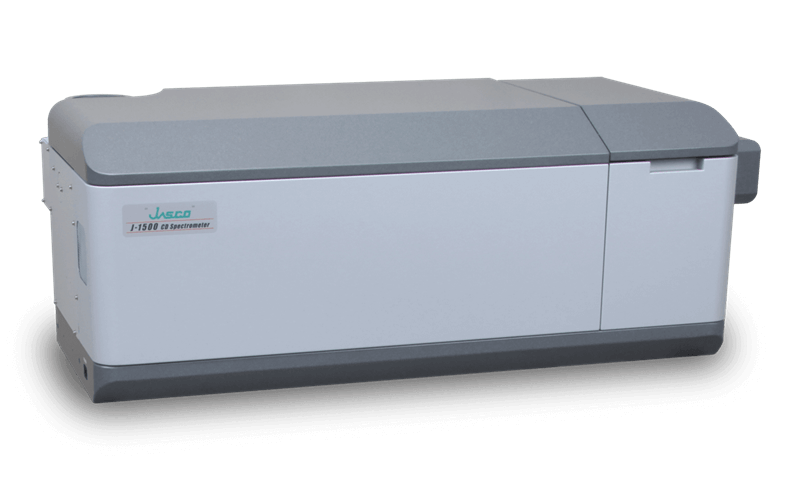
J-1500 CD Spectrometer
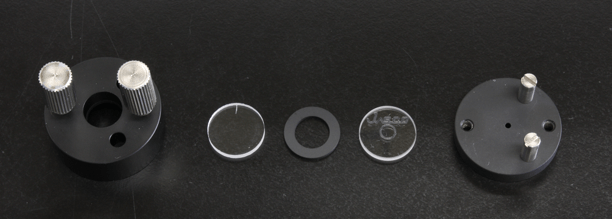
Figure 1. Microsampling disc components (demountable cell, 2 windows and a spacer)
Experimental
Measurement parameters
Path length: 1 mm
Sample concentration: 0.1 mg/mL
Bandwidth: 1 nm
Data interval: 0.1 nm
Scan speed: 100 nm/min
Response: 2 sec
No of scans: 4 times (MSD), 1 time (Conventional cell)
Measurement time: 2.8 min (MSD), 42sec (Conventional cell)
To use the microsampling disc shown in Figure 1, the sample is dropped onto the central part of the MSD. The disc is then assembled and clamped. The MSD is then placed in a vertical position in the sample holder.
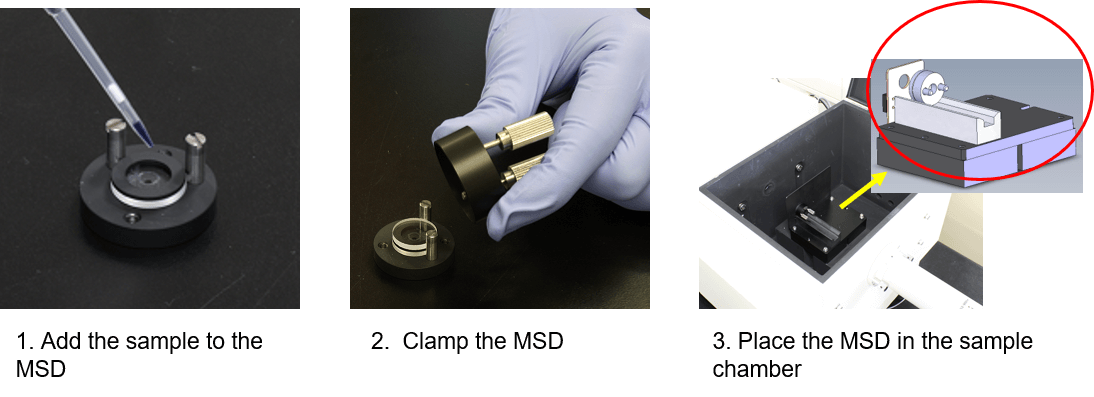
Figure 2. Diagram of procedure for using the microsampling disc
Results
The CD spectra depicted in Figure 3 compare the results obtained using the MSD and a conventional cell. The microsampling disc (green line) provided near identical spectra compared to the cylindrical cell (blue line) used. The data also show that secondary structure between 260 and 190 nm can be measured in less than three minutes using the MSD.
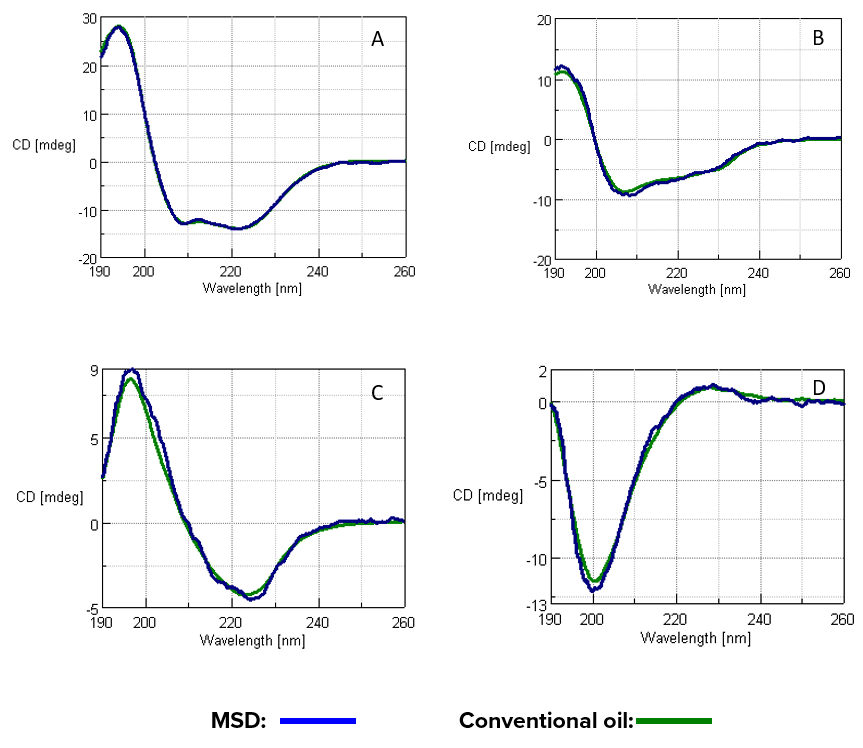
Figure 3. CD spectra of (A) hemoglobin, (B) lysozyme, (C) concanavalin A, and (D) trypsin inhibitor using a microsampling disc (blue) and cylindrical cell (green).
Conclusion
This application note demonstrates that the One-Drop microsampling disc is an easy to use method for obtaining reliable and quick results for small-volume and low-concentration samples.


