Introduction
Key Points
This measurement method allows acquisition of a Raman spectrum with reduced influence from fluorescence emitted by the sample.
< Introduction >
In Raman spectroscopy, an excitation wavelength of 532 nm is often chosen due to the higher sensitivity of the detector at this wavelength and the higher intensity of the Raman scattered light. However, at this excitation wavelength, fluorescence emitted from the sample can increase the baseline, posing a challenge for analysis1). One known method to address this issue is to increase the excitation wavelength to avoid fluorescence from the sample2). On the other hand, since the intensity of Raman scattered light is approximately inversely proportional to the fourth power of the excitation wavelength3), the use of a longer excitation wavelength results in a decrease in the Raman scattering intensity.
In the experiment reported in this study, a Raman microscope equipped with a 1064 nm excitation wavelength laser was used to measure two types of fluorescent samples that are difficult to analyze with excitation wavelengths in the visible region, such as 532 nm. The effectiveness of this approach was further confirmed by performing Raman measurements on microscopic plastic particles. The instrument used in this study is equipped with various optical components, including a detector and objective lenses optimized for the near-infrared region. As a result, the reduction in Raman scattering intensity due to the use of a long-wavelength laser is mitigated.
Experimental
Sample
Polyether ether ketone (PEEK) plastic, Cassis liqueur, Polystyrene (PS) particles (⌀2 µm)
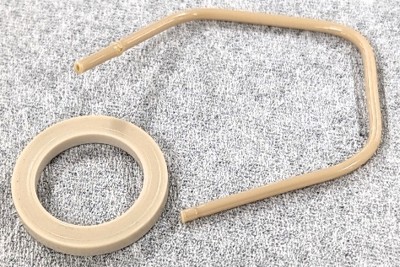
Fig. 1 PEEK plastic
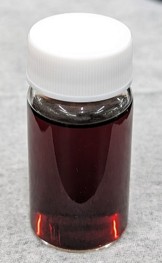
Fig. 2 Cassis liqueur
System
Instrument: NRS-4500 Raman spectrometer
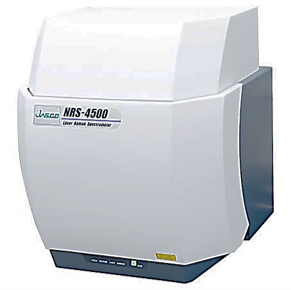
Fig. 3 NRS-4500 Raman spectrometer
Parameters
Ex wavelength: 1064 nm
Objective lens: 20x for near-infrared region (for PEEK and cassis liqueur), 100x for near-infrared region (for ⌀2 µm PS particles)
Rejection filter: 1064 nm long-pass edge filter
Detector: InGaAs detector
*Other than the parameters above, the measurements were conducted using optimal parameters for each sample.
Keywords
Raman spectroscopy, reduction of fluorescence interference, near-infrared excitation, 1064 nm laser, Raman microscope
Results
Fluorescent samples
Figure 4 shows the Raman spectrum of PEEK, which is a type of engineering plastic, measured at an excitation wavelength of 1064 nm.
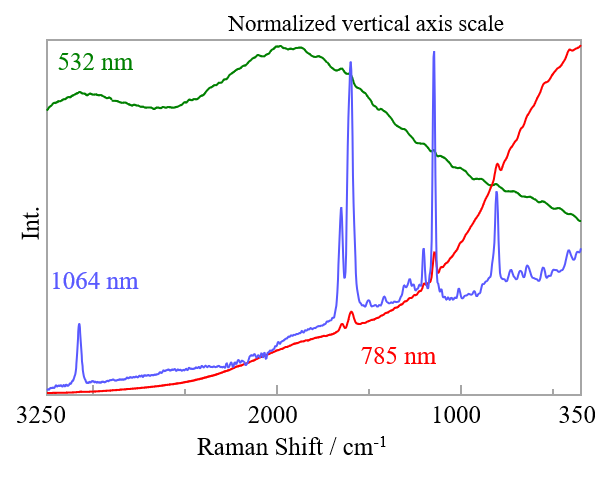
Fig. 4 Raman spectra of PEEK for different excitation wavelengths
For comparison, spectra at excitation wavelengths of 532 and 785 nm are also shown. In the spectrum excited at 532 nm, the Raman peaks associated with the molecular structure are almost undetectable due to the strong fluorescence emitted from the sample, while in the spectrum excited at 785 nm, the fluorescence is reduced and Raman peaks are weakly observed. However, if an excitation wavelength of 1064 nm is used, baseline elevation due to fluorescence is strongly suppressed, resulting in much clearer Raman peaks. As shown in Figure 5, the use of an excitation wavelength of 1064 nm allows the peaks due to different functional groups in PEEK to be easily assigned.
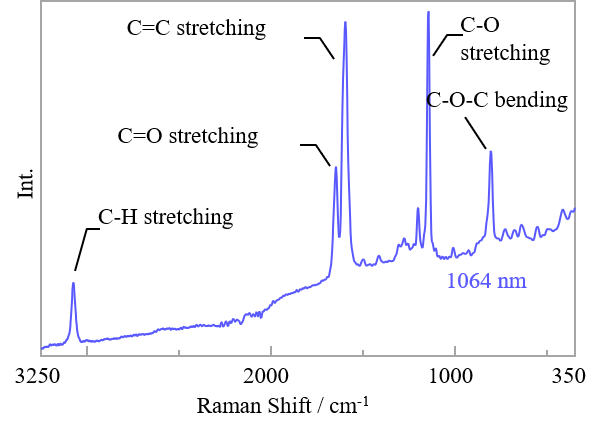
Fig. 5 Raman peak assignment for PEEK
Thus, changing the excitation wavelength from the visible to the near-infrared region reduces sample fluorescence, allowing a qualitative analysis of the Raman spectrum.
Figure 6 shows the Raman spectrum of a colored liquid (cassis liqueur) measured at an excitation wavelength of 1064 nm.
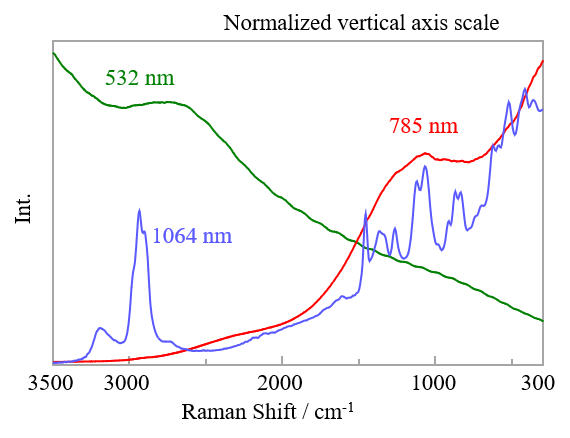
Fig. 6 Raman spectra of cassis liqueur for different excitation wavelengths
As in Figure 4, spectra at excitation wavelengths of 532 nm and 785 nm are also shown for comparison. No clear peaks are seen in the spectrum excited at 532 nm, nor in that excited at 785 nm, a wavelength commonly used to avoid sample fluorescence. However, the spectrum excited at 1064 nm exhibits clear peaks. As shown in Figure 7, each peak can be easily assigned, and those corresponding to ethanol and sugar can be identified.
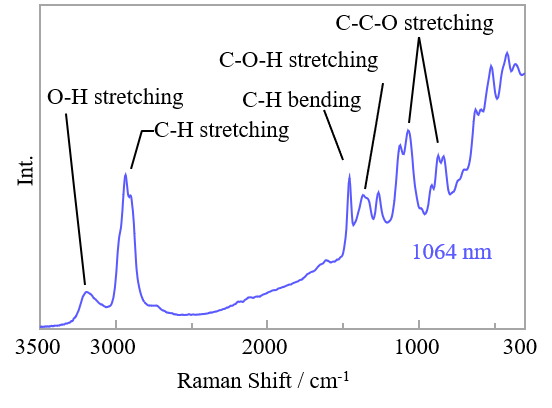
Fig. 7 Raman peak assignment for cassis liqueur
Thus, even for samples where useful Raman spectra cannot be obtained by excitation at 785 nm, high-quality spectra can be acquired using an excitation wavelength of 1064 nm.
Plastic particles
Figure 8 shows the measurement results for polystyrene particles with a diameter of 2 µm using an excitation wavelength of 1064 nm, and Figure 9 presents the results of a database search for the obtained Raman spectrum.
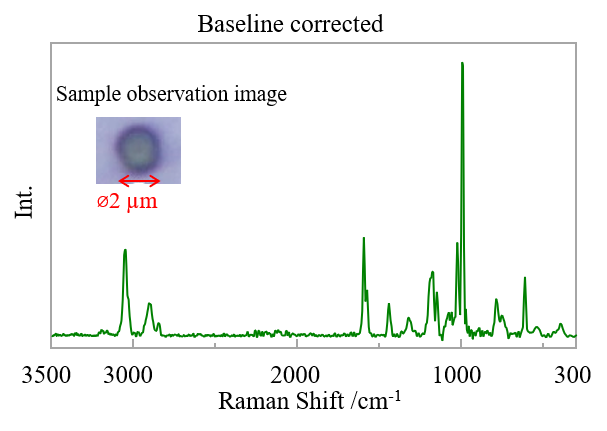
Fig. 8 PS image and Raman spectrum
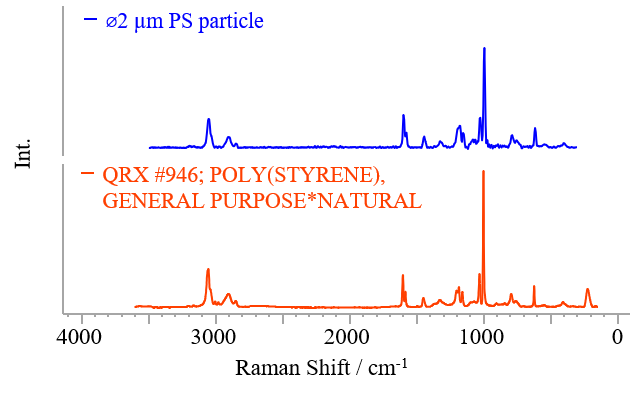
Fig. 9 Database search results for Raman spectrum
From Figures 8 and 9, it can be seen that the obtained Raman spectrum is of sufficient quality for qualitative analysis. The theoretical laser spot size at a wavelength of 1064 nm is approximately 2 µm. Even when measuring plastic particles with a size comparable to this laser spot size, qualitative analysis using Raman spectroscopy is possible.
Conclusion
Using a JASCO Raman microscope equipped with a laser that allows excitation at 1064 nm suppresses sample fluorescence, making it possible to measure samples that are difficult to analyze with excitation wavelengths in the visible region. Additionally, qualitative analysis of microscopic particles using Raman spectroscopy was shown to be applicable to microscopic measurements. Since excitation at 1064 nm allows greater suppression of fluorescence than visible excitation, this analytical method can be useful for analyzing highly fluorescent samples such as pharmaceuticals, pigmented materials, and biological materials.
References
1.H. Kawasaki, Y. Nakahara, T. Hasegawa (Eds): “Handbook of Instrumental Analysis. 1”, p. 163 (2020), (Kagaku-Dojin Publishing Company, INC)
2.M. Tasumi (Ed): “Infrared Spectroscopy –Basics and Latest Methods”, The Spectroscopical Society of Japan Edition, p. 185 (2012), (ST Japan Inc.)
3.H. Hamaguchi, K Iwata (Eds): “Raman Spectroscopy”, P.53 (2015), KODANSHA SCIENTIFIC LTD.


