Introduction
IgG, which is a type of antibody, is used as a drug substance for antibody drugs. It is known that IgG may form dimer, trimer, and aggregates due to mechanical stress in each process during manufacturing and environmental factors during transportation and storage. Since aggregates in antibody drugs can reduce drug efficacy and cause side effects, it is necessary to evaluate monomer, multimers, and aggregates for quality control. In 2014, the U.S. Food and Drug Administration (FDA) has provided guidance on the evaluation of immunogenicity of therapeutic protein products and recommended that the validity of each analysis result should be judged while comparing the results using multiple methods (Orthogonal Method) with different measurement principles for protein aggregates contained in biopharmaceuticals.
This time, we show the results of measuring human serum-derived IgG reagent by size exclusion chromatography (SEC), which is one of the analytical methods for aggregates, and separating and detecting monomer, multimers, and aggregates.
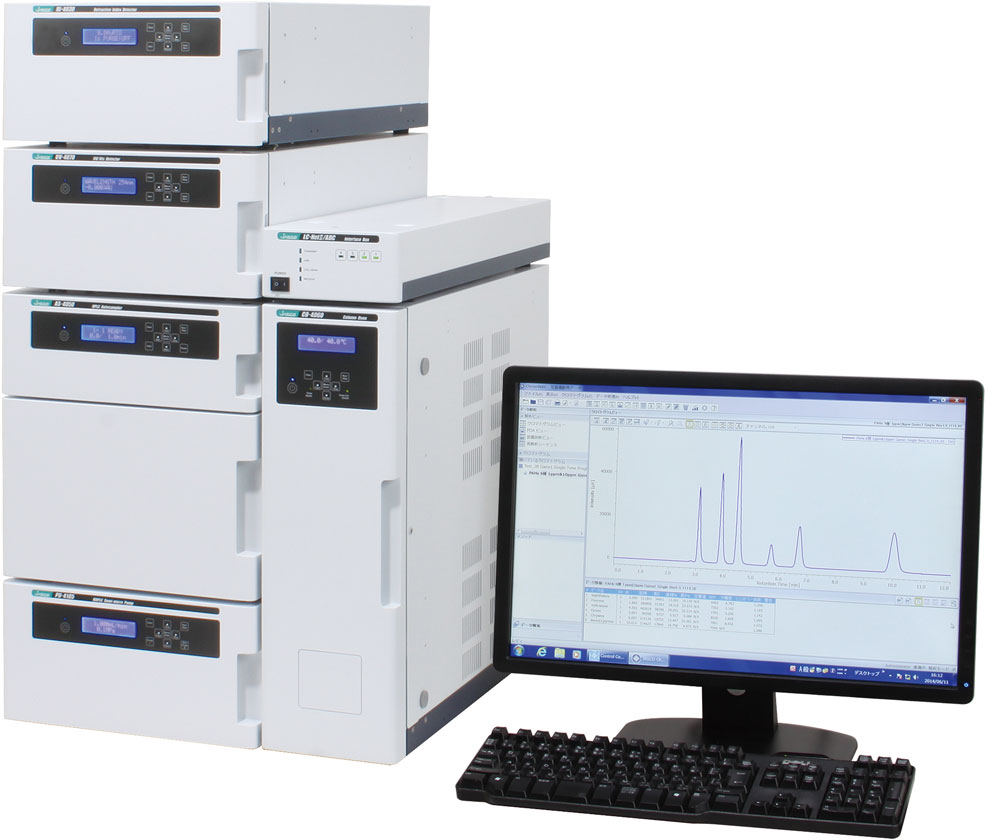
LC-4000 GPC system
Experimental
<Experimental conditions>
Column: TSKgel G3000SWXL (7.8 mmI.D. x 300 mmL, 5 µm)
Eluent: 0.2 mol/L sodium phosphate buffer (pH 6.7)
Flow rate: 0.8 mL/min.
Column temp.: 25 ºC
Wavelength: 220 nm
Injection volume: 10 µL
Standard: Protein standard mix 15-600 kDa (Merck), 30 mg/mL in water
Sample: IgG from human serum (Merck), 1 mg/mL in water
Keywords
antibody, IgG, antibody drug, biopharmaceutical, aggregate, TSKgel G3000SWXL, SEC, UV detector
Results
Figure 1 shows a UV chromatogram of a protein standard sample. As reference data, an RI chromatogram is also shown, which was measured by connecting an RI detector downstream of the UV detector.
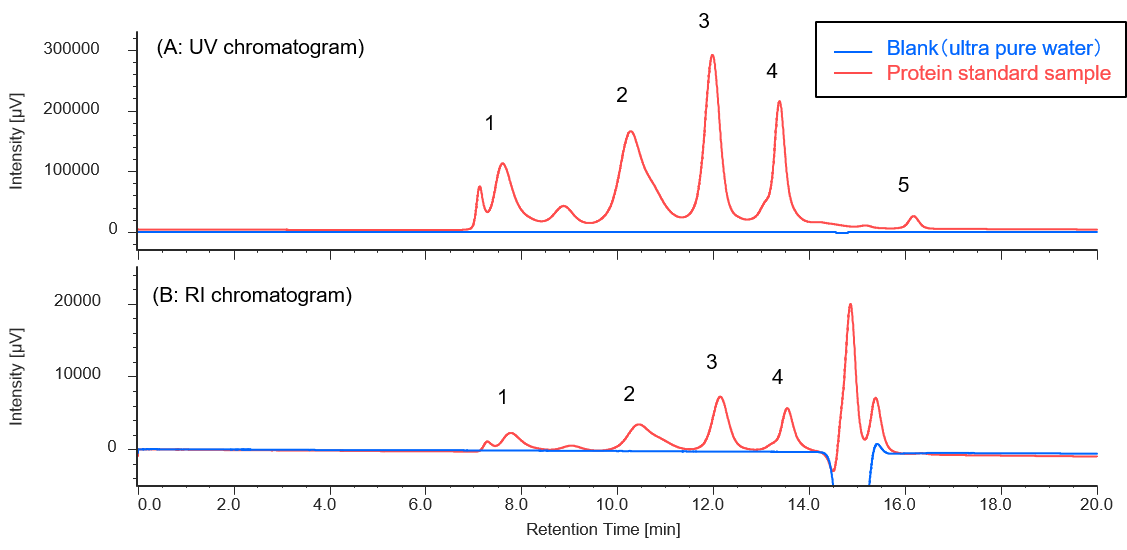
Figure 1. Chromatograms of protein standard sample (1: Thyrogrobulin (MW 670,000), 2: γ-globulins (MW 150,000), 3: Ovalbumin (MW 44,300), 4: Ribonuclease A (MW 13,700), 5: p-aminobenzoic acid (MW 137))
Figure 2 shows a UV chromatogram of human serum-derived IgG reagent. The molecular weight calibration curve is overwritten on this figure.
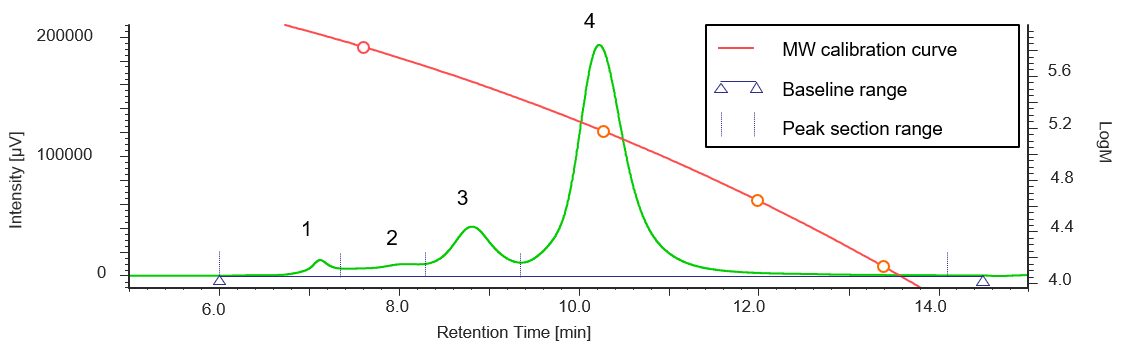
Figure 2. UV chromatogram of human serum-derived IgG reagent
In addition, Table 1 shows the calculation results of the peak-top average molecular weights (Mp) of human serum-derived IgG and the area ratio of each section, and Figure 3 shows the molecular weight distribution curves of each section.
Table 1. Calculation results of peak-top average molecular weights and the area ratio of human serum-derived IgG reagent converted based on the results of standard sample
| Peak No. | Section range [min.] | Baseline range [min.] | tR [min.] | Mp | Section area | Area % |
| 1 | 5.967-7.377 | 5.967-14.523 | 7.127 | 835015 | 255720 | 2.44 |
| 2 | 7.377-8.300 | 5.967-14.523 | 8.017 | 548939 | 426521 | 4.07 |
| 3 | 8.300-9.373 | 5.967-14.523 | 8.810 | 362067 | 1495157 | 14.28 |
| 4 | 9.373-14.127 | 5.967-14.523 | 10.227 | 154964 | 8292538 | 79.2 |
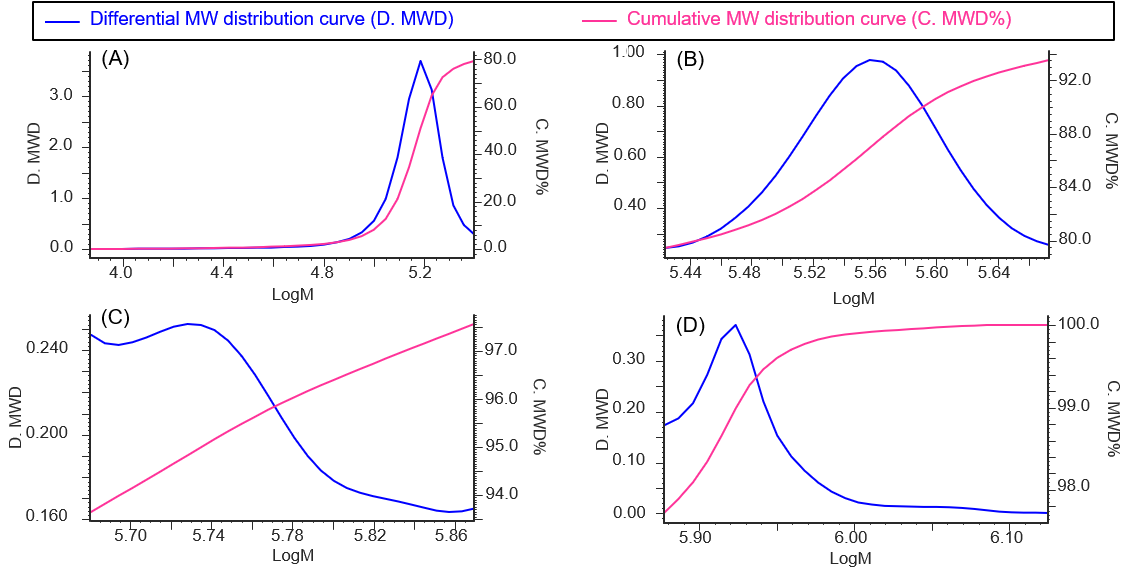
Figure 3. Molecular weight distribution curves for each section of human serum-derived IgG reagent (A: Peak 4, B: Peak 3, C: Peak 2, D: Peak 1)
From the Mp in Figure 3 and Table 1, it was estimated that peak 4, peak 3, and peaks 2 and 1 correspond to an IgG monomer, dimer, and aggregates with a higher molecular weight, respectively. In addition, based on the ratio of each section area, the human serum-derived IgG reagent measured in this experiment was found to contain approximately 79% of monomer (peak 4) and approximately 21% of aggregates including multimers (peaks 1 to 3).
References
lU.S. Food and Drug Administration, “Guidance for Industry: Immunogenicity Assessment for Therapeutic Protein Products.”, https://www.fda.gov/media/85017/download, (2014).
Related Posts:
 Monitoring of Aggregates and Degradation Products by…
 Analysis of Styrofoam by GPC/SEC using mixed gel column
 GPC/SEC measurement of Polystyrene Oligomers using…
 Higher Order Structure, Stability, and Similarity…
 Rapid and Robust Evaluation of Higher Order…
 Base Material and Dye Analysis - Combined Raman and…