Introduction
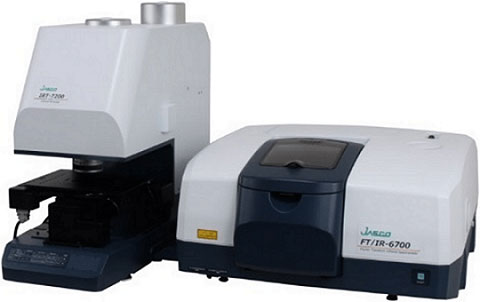
FTIR microscope system
Imaging measurement using Micro FT-IR is widely used as a method which can visualize the components distribution. In recent years, the users can chose the most appropriate imaging method in accordance with their purpose because a variety of imaging methods has been available due to the progressive development of the high-speed imaging measurement methods using a multi channel detector and IR microscope. The imaging measurement for handling enormous amount of the data, however, requires significant time and special skill for analysis. For example, Figure 1 shows the imaging analysis result of a multilayer film. It can be seen that the spectrum of each portion is checked and the intensity distribution of the key peaks is shown as the color-coded image.
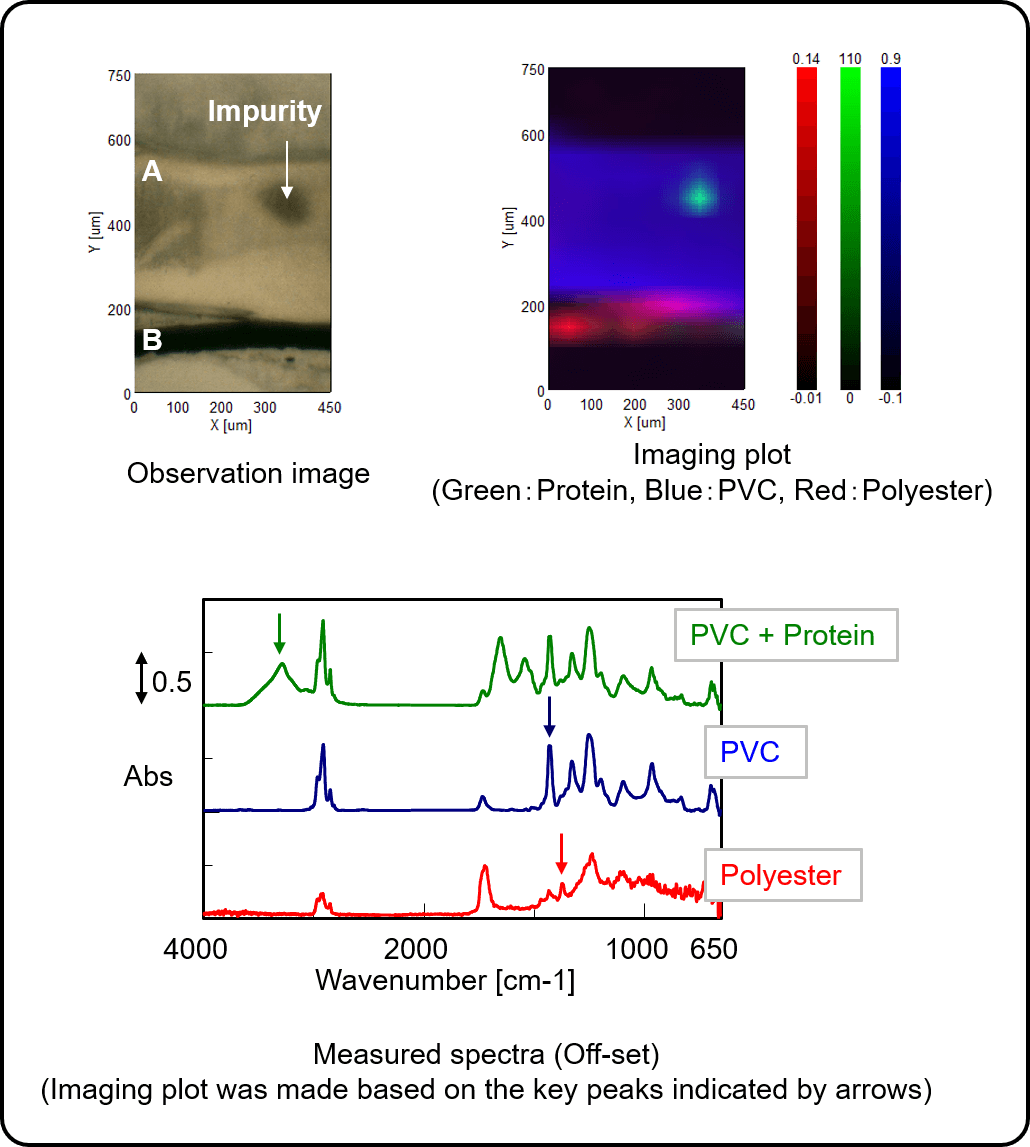
Figure 1. Imaging analysis result of multilayer film with key peaks
From the spectra, it is seen that three kinds of components were contained in the film, while from the images, it is considered that polyvinyl chloride (PVC) and polyester are found in A layer and B layer of the multilayer film respectively and that protein is contained as an impurity in the PVC layer. As shown in the above, the components distribution can be discerned by analyzing the imaging data. On the other hand, there is a possibility that some components in the sample may be neglected as the number of the data becomes larger.
This article illustrates an example of the imaging data analysis using “Model Analysis” in Micro Imaging Analysis program (shown in Figure 2). The “Model Analysis” is one of the functions to assist the analysis in the Micro Imaging Analysis program such as making an image without checking the spectrum.
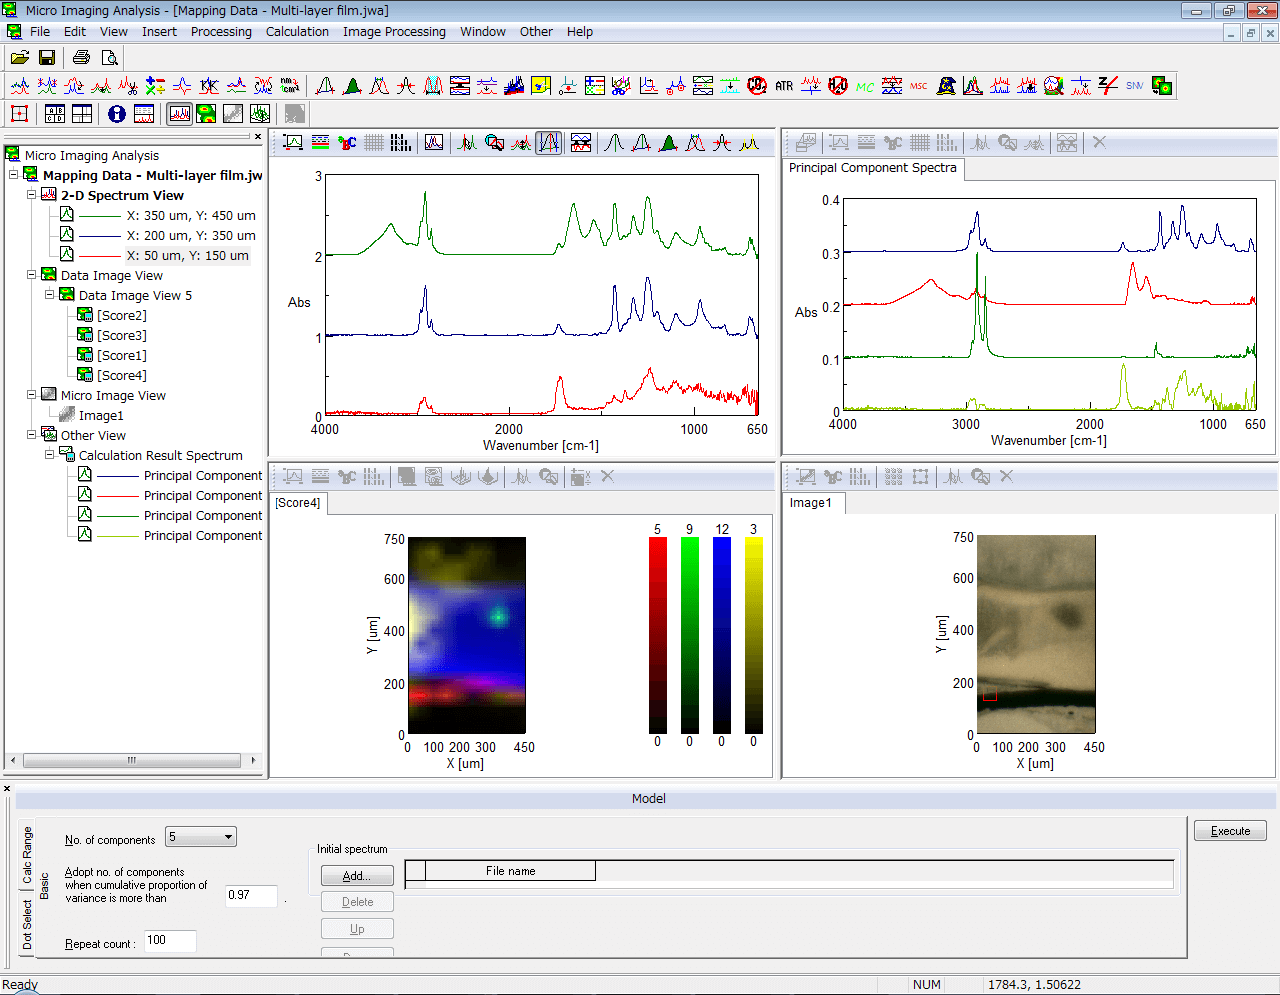
Figure 2. Micro Imaging Analysis Program
Model Analysis
“Model Analysis” is a function to make a relative concentration distribution by extracting the principal components automatically from the measured spectra. Therefore, the imaging plot can be obtained in a short time without neglecting the components contained in the sample as explained in the above. It is also possible to identify the components by searching the spectrum of principal components in the data base.
Figure 3 shows the imaging analysis result of a multilayer film using “Model Analysis”.
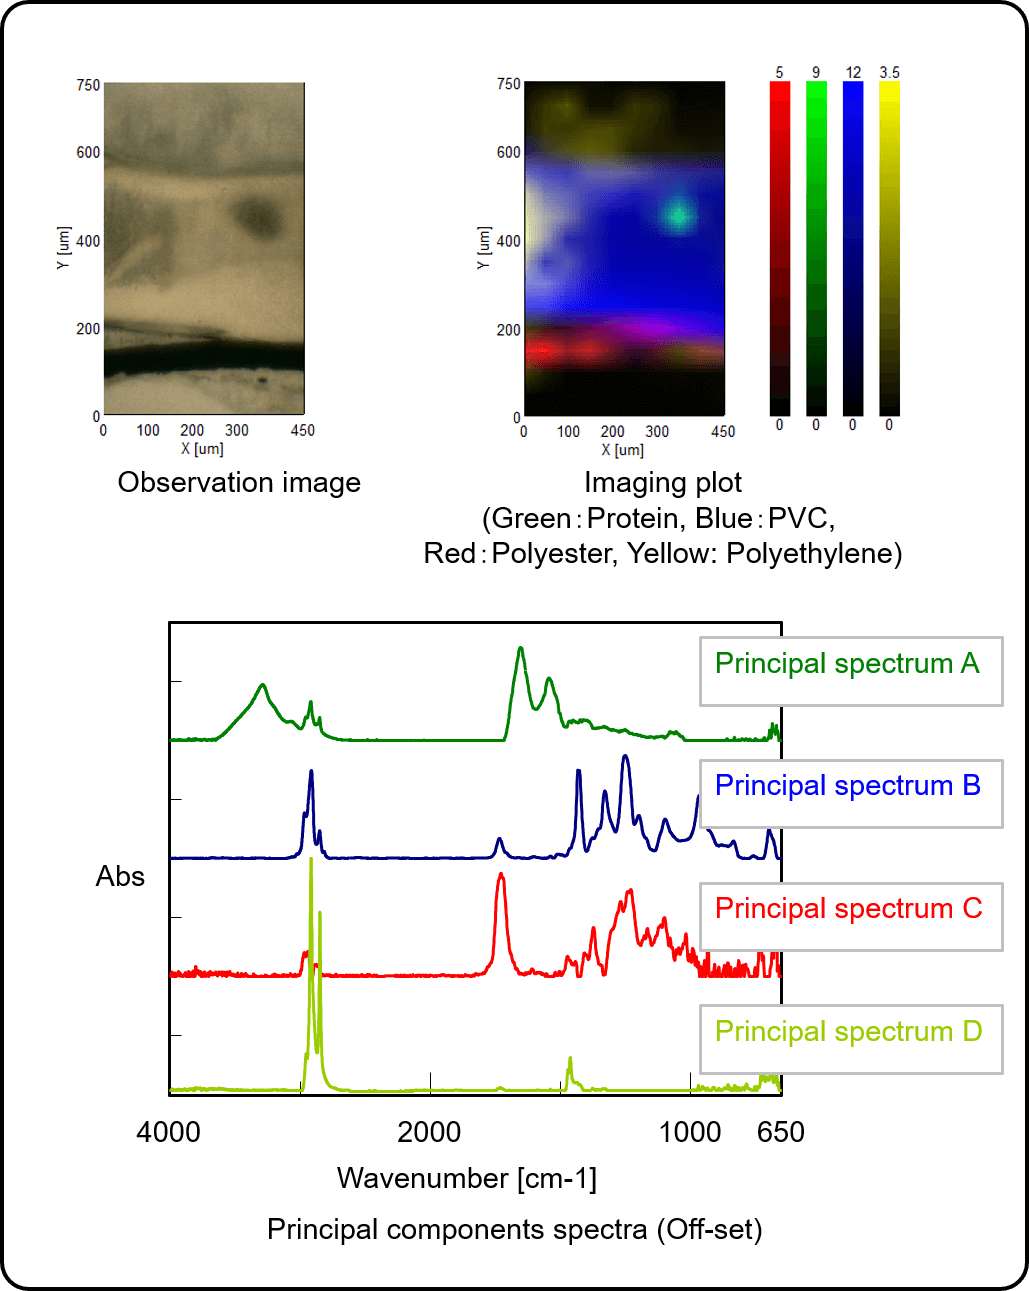
Figure 3. Imaging analysis result of multilayer film with “Model analysis”
Comparing the data in Figure 1 with the data in Figure 3, two differences can be observed. One is that the spectrum of the fourth component was contained in the spectrum of primary component. It is indicating that the component possibly neglected by Imaging Analysis using key bands can be accurately analyzed by using “Model Analysis”. The other is the difference in the impurity spectra. The pure spectrum of the protein as an impurity can be obtained using “Model Analysis”, while the overlapped spectra of protein and PVC in the multilayer were obtained as the measured spectrum by the method using key bands. The spectrum of pure component improves the accuracy for searching databases and facilitates the identification of the components. Figure 4 illustrates the database search result of the principal components. Polyethylene was found to be as a principal component which was neglected by the Imaging analysis using key peaks.
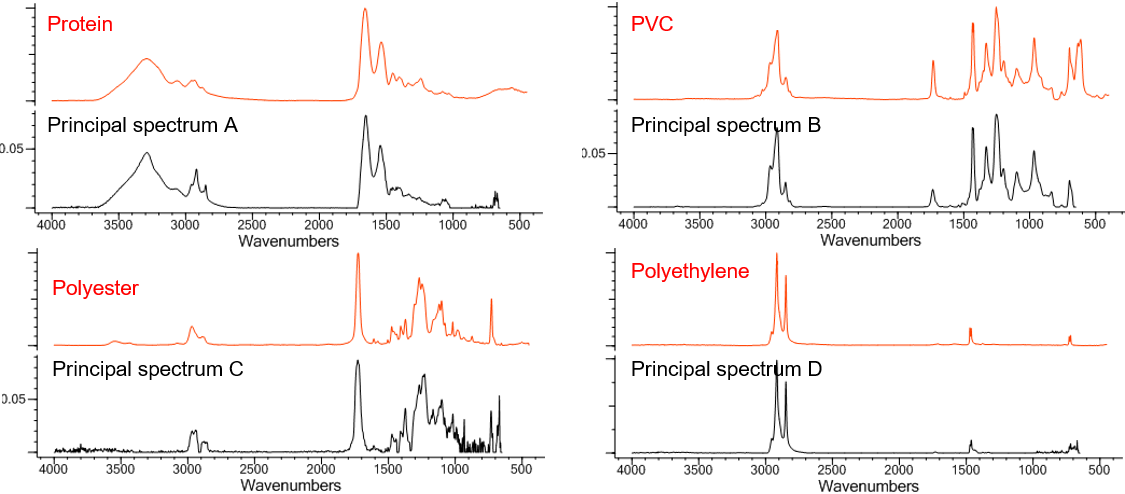
Figure 4. Database search result of principal components spectra
As described above, the “Model Analysis” makes it possible to obtain the imaging plot of all contained principal components without checking the spectrum, which improves the accuracy of searching the databases.


 Analysis of CBN-Binding DNA Aptamer using CD Spectroscopy")
