Principles of Raman Spectroscopy (9) Raman spectroscopy FAQ – Measurement related –

December 9, 2021

Measurement related

Q27. Does high speed imaging have any merit other than shortening the measurement time?
By scanning the stage in the X, Y, and Z directions using the height information of the omnifocal image, it is possible to accurately image even samples such as tablet imprints on a surface.

Q28. When measuring the cross section of the tablet, there is unevenness and I can not measure well. What should I do now?
Make the cross section as smooth as possible and use a low magnification or long working distance lens. In addition, by using surface scan (SSI) as the measurement method, the stage can be scanned in the XYZ directions, and samples with large surface irregularities (tablet imprinted parts) can be measured.

Fig. 32 Measurement of engraved part of tablet

Q29. When the measurement time is the same, should the exposure time or number of accumulations be increased?
Basically, if you set a longer exposure time (by setting the number of accumulations to 2 for cosmic ray removal), you can measure the SN ratio well.
A Raman spectrophotometer uses a charge storage type CCD detector as a detector. The shape of the spectrum is first understood by converting the signal accumulated in the CCD for a certain period of time into charge, which is displayed on the preview screen (usually 1 second). There is a slight noise when converting this accumulated Raman scattering signal to charge, so if the measurement time is the same, increasing the exposure time will increase the signal-to-noise ratio.
However, if the CCD detector becomes saturated when the exposure time is extended, increase the number of accumulations and increase the SN ratio.

Q30. What is the merit of low wavenumber measurements?

In the low wavenumber region, it is possible to observe skeletal vibrations such as in monosubstituted benzene, lattice vibrations (vibrations of atoms in the crystal) and vibration modes between heavy atoms. In particular, with a low wavenumber of 500 cm-1, it is possible to determine, for example, differences in crystal structure between calcium carbonate and titanium oxide, and between quartz and fused silica.

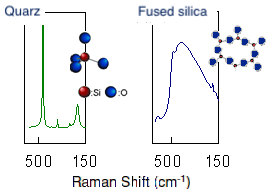
In Fig. 33, it can be seen that quartz (crystalline) has a sharp peak and fused silica (amorphous) has a broad peak.

Q31. With the 532 nm laser, is there a technique to reduce the influence of fluorescence?
The following three methods can be considered.
1. Use a high-magnification lens, and reduce the slit and aperture width to increase the spatial resolution.
2. Use the automatic fluorescence correction software function.
3. Apply a photobleaching technique for fluorescence fading before Raman measurement.

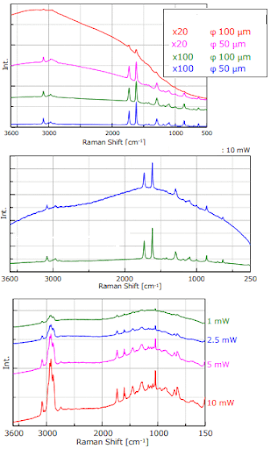
Fig. 34 Increased spacial resolution(Top), software correction (Middle), and photobleaching (Bottom).

Q32. Is there any way to measure polarization with Raman? What information can we get?
There are two methods. One is to rotate the sample, and the other is to rotate the polarization plane of the laser by 90 degrees using a 1/2λ plate. The following information can be obtained;
1. Orientation of molecules.
2. Depolarization of a randomly oriented system such as a liquid sample or a gas. Information on the symmetry of vibrations can be obtained and used as a reference for peak assignment.
3. Analysis of lattice vibration in crystals. The results can be used to evaluate the crystal orientation or plane direction.

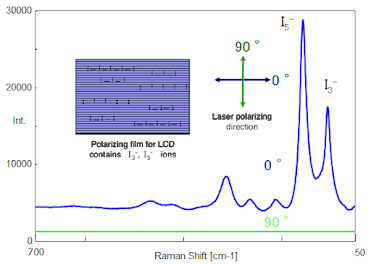
Fig. 35 Orientation analysis of polyiodine ions in polarizing film

Q33. I would like to measure carbon powder. How should I install the sample?
The powder can be measured by dispersing it on a glass slide.

Q34. Can a quantitative analysis be performed using Raman spectroscopy?
It is possible to perform a semi-quantitative using Raman peaks. However, in the case of non-uniform samples such as emulsions, it is difficult to obtain accurate results.