Q36. What kind of data processing is available with Raman spectroscopy?
Automatic fluorescence correction, sensitivity correction, and digital filters can be used.
An example of automatic fluorescence correction is shown in Fig. 37. It can be seen that the uncorrected baseline is high due to the influence of fluorescence, and it is difficult to clearly distinguish peaks.
The use of a digital filter can eliminate the influence of cosmic rays and noise, as shown in the lower spectrum.
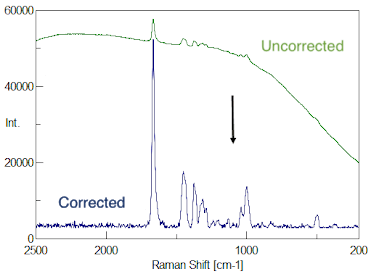
Fig. 37 Raman spectrum before and after automatic fluorescence correction
Q37. Can I obtain complementary FTIR and Raman measurement data?
By using the sharing holder and performing FTIR and Raman measurements, you can easily acquire data for the same sample at the same position.
Figure 38 and 39 shows imaging and spectral data for a multilayer film using IR and Raman measurements. In the IR spectrum, peaks due to cellulose are clearly observed. In the Raman spectrum, a peak due to TiO2 is identified, and the two components can be used to perform a more detailed analysis.
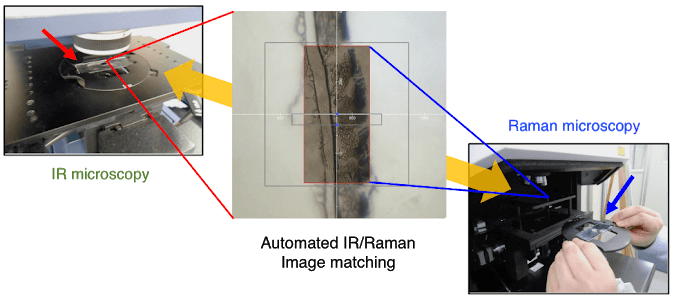
Fig. 38 Measurement of multilayer film using sharing holder
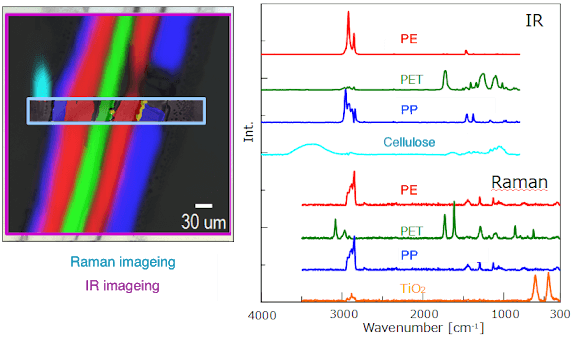
Fig. 39 Measurement of multilayer film by IR and Raman spectroscopy


