Principles of HPLC (1) HPLC as a separation analysis method

October 6, 2020

HPLC is an abbreviation for high-performance liquid chromatography. Chromatography refers to the measurement method, chromatogram refers to the measurement results, and chromatograph refers to the instrument. Chromatography separates components in a particular substance and performs qualitative and quantitative analyses. Qualitative analysis refers to “what kind of compound each component is”, and quantitative analysis refers to “how much of each component is present” (Fig. 1).

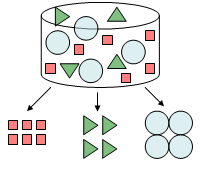
Fig. 1 Separating mixtures into their components

The beginning of chromatography

Methods for separating mixed compounds include filtration, distillation, and extraction. Chromatography was invented by the Russian botanist Mikhail Semenovich Tswett. In the early 1900s, Tswett packed calcium carbonate in a standing tube, placed pigments extracted from plants on top, and then flushed the tube with petroleum ether as a solvent (Fig. 2). Individual pigments appeared as color bands as if the light was divided into seven colors by a prism in the tube. For this reason, Tswett named this separation method chromatography using the Greek words chroma (color) and graph (record). High-performance liquid chromatography (HPLC) is a type of separation method referred to as column chromatography, and has been developed to enable separation and analysis in a short time using high pressure.

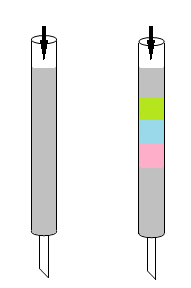
Fig. 2 Tswett's chromatograph

Separation mechanism in chromatography

A mixture is placed in a stream of liquid (petroleum ether in Fig. 3) called the mobile phase and moved through a solid medium (calcium carbonate powder in Fig. 3) called the stationary phase. The components in the mixture move with the flow of the mobile phase, and interact with the stationary phase. The speed of movement depends on the strength of the interaction between each component and the stationary phase. That is, components that interact strongly with the stationary phase move slowly, whereas components that interact weakly move quickly, so allowing the components to be separated.

Fig. 3 Chromatogram (bottom) and separation mechanism (top)

The separated components can be analyzed using different types of detectors. A UV detector, for example, can detect components based on UV absorption. The chromatogram is obtained by measuring the elution time on the X axis and the intensity of the UV signal on the Y axis. If the measurement conditions are the same, the elution time (peak position) for the standard sample whose components are known and that for the unknown sample can be compared to identify the components. In addition, since the absorption intensity is proportional to the concentration, a calibration curve can be prepared using a standard sample, and the component concentration can be determined by measuring the peak area or height.