Introduction
< Key Points >
This reports describes the new JASCO [HTCD Batch Processing] software program. This program performs data processing procedures such as data accumulation (averaging), baseline correction and calculation of average molar ellipticity for a large amount of circular dichroism (CD) and absorbance data obtained using the HTCD Plus high-throughput CD measurement system.
The market for antibody drugs has expanded dramatically over the past few decades and such drugs are now among the leading biopharmaceutical products. Antibodies, which are proteins, form a higher-order structure (HOS) and express their functionality through a complex series of non-covalent bonds. Evaluation of the stability of the HOS when subjected to external stimuli is extremely important because changes in buffer conditions or other factors can induce structural changes that cause antibody drugs to lose their active functions. In the development of biosimilars, which are follow-on biologics of antibody drugs, assessment of HOS similarity with the original innovator is very important for ensuring the efficiency of clinical trials. CD spectroscopy is a quick and easy method for obtaining information on the secondary and tertiary structure of proteins in solution. It is widely used for evaluating the stability of the HOS of proteins when subjected to external stimuli, and the similarity of the HOS of innovators and biosimilars. Since these evaluations require CD spectra of a large number of samples, the HTCD Plus, a high-throughput CD measurement system capable of automatically measuring the spectra of up to 192 samples, has been developed. Furthermore, to evaluate the stability and similarity of the HOS based on the acquired spectra, data preprocessing is required for a large number of spectra. Therefore, JASCO has developed the companion software [HTCD Batch Processing], which allows predefined data processing steps to be performed in a single run for CD and absorption spectra obtained using the HTCD Plus. In the present study, after obtaining spectra of Rituximab under different pH conditions using the HTCD Plus, the data were preprocessed in a single batch using the [HTCD Batch Processing] program. The pH dependence of the secondary structure of Rituximab was then evaluated using the [BeStSel] program*, which is capable of estimating secondary structure composition ratios with high accuracy. This report describes the results of these procedures and analyses, and the efficiency with which they can be performed.
*The JASCO Spectra Manager 2.5 BeStSel program was developed in collaboration with Dr. József Kardos and Dr. András Micsonai of the University of ELTE and JASCO.
Experimental
Sample
Antibody drug: RIABNI (Rituximab, AMGEN Inc.) 0.2 mg/mL
Buffer: Phosphate buffer
System
Instrument: HTCD Plus High-throughput CD spectrometer
Software: HTCD Batch Processing program, BeStSel program
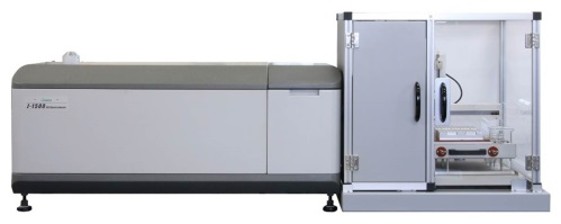
Fig. 1 HTCD system (J-1500 + HTCD Plus)
Parameters
Wavelength range: 200 nm-250 nm
Scanning speed: 50 nm/min
D.I.T.: 2 sec
Bandwidth: 1.0 nm
Data pitch: 0.1 nm
Accumulations: 4
Cell path length: 1 mm
Keywords
Streamlining, automation, antibody drugs, BeStSel, higher-order structure, HOS, secondary structure, circular dichroism spectrometer, Rituximab
Results
Measurement procedure
Figure 2 shows the arrangement of samples on a microplate.
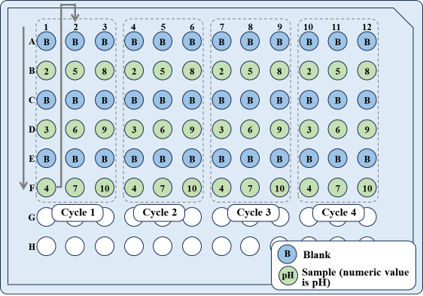
Fig. 2 Sample arrangement on microplate
Nine samples dissolved in buffer prepared at pH 2-10 and the corresponding blanks were measured alternately, and four measurements were performed for each sample to accumulate the spectra.
As a result, a total of 72 samples were automatically measured.
Data processing
Figure 3 compares the number of steps for manual data processing and for the [HTCD Batch Processing] program. Manual processing of all 72 samples required 126 steps. On the other hand, using the [HTCD Batch Processing] program, the entire process could be completed in only 7 steps.
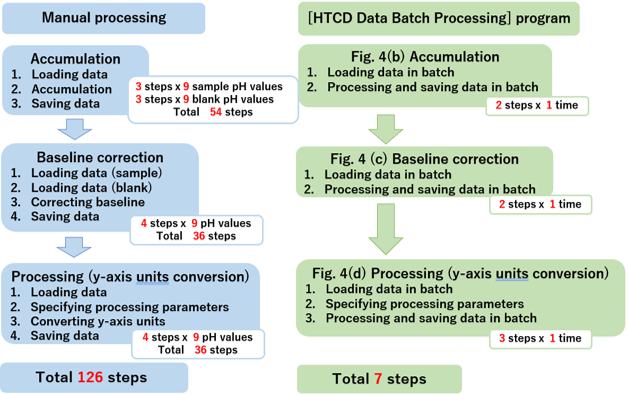
Fig. 3 Analysis flow
Figure 4 shows spectra obtained in each step of the process using the [HTCD Batch Processing] program. The original 72 spectra were converted into 9 spectra showing the average molar ellipticity for each step. Thus, the [HTCD Batch Processing] program allows efficient and easy data processing for a large number of sample spectra, and automatic saving of the processed data. To convert to the average molar ellipticity, since the molar absorption coefficient for the sample can be calculated simply by entering the protein sequence in the data processing parameter settings, and the molar concentration is accurately calculated from the absorption spectrum associated with the CD spectrum, the [HTCD Batch Processing] program allows vertical axis conversion to be easily performed.1,2)
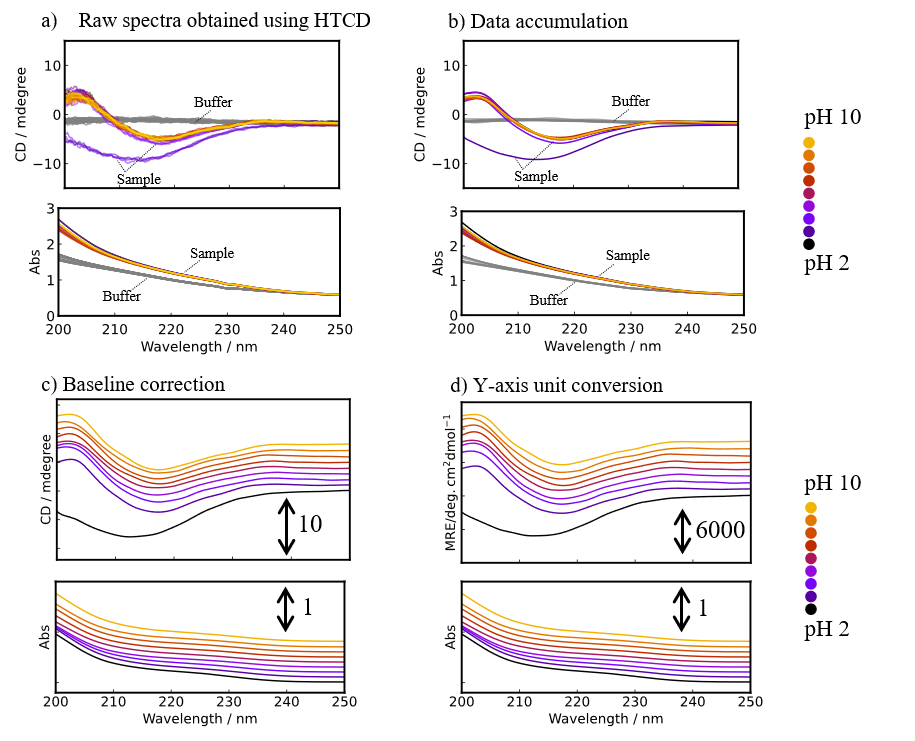
Fig. 4 Spectra obtained during analysis process
Secondary structure analysis using [BeStSel] program
The secondary structure composition ratios for nine samples obtained under different pH conditions, whose spectra were processed using the [HTCD Batch Processing] program, were determined using the [BeStSel] program. Figure 5 plots the difference in secondary structure ratio relative to that at pH 7 for each type of secondary structure. The results for a pH of 3-10 show no significant changes in secondary structure, while at pH 2 a decrease in the ratio for strand structures and an increase in that for helix and other structures are observed. Thus, the secondary structure of Rituximab is stable in the pH range of 3-10.
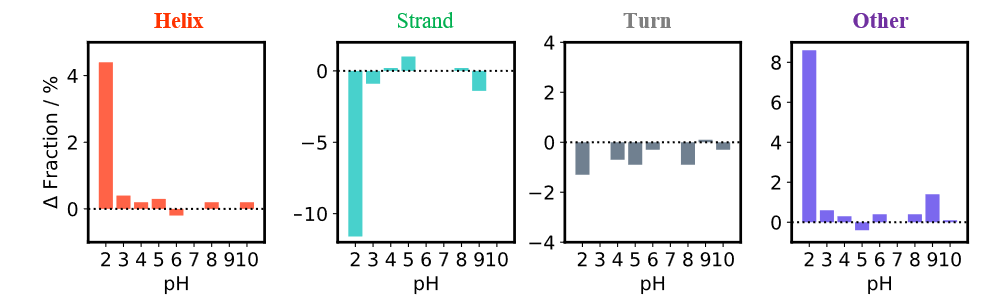
Fig. 5 Secondary structure analysis results for Rituximab under different pH conditions
Conclusion
The [HTCD Batch Processing] program was used to perform complex data processing procedures for CD and absorption spectra of a large number of samples obtained using the HTCD Plus. The [BeStSel] program was then used to evaluate the pH dependence of the protein secondary structure composition ratio. Thus, the [HTCD Batch Processing] program enables efficient and easy data preprocessing for determining the protein secondary structure using the [BeStSel] program. It can also be used for preprocessing data for use with the JASCO [qHOS] program for similarity analysis of the HOS for different antibody drugs.
References
1)BAS J. H. Kuipers, H. Gruppen: J. Agric. Food Chem., 55, 5445-5451 (2007). DOI: 10.1021/jf070337l
2)N. J. Anthis, G. M. Clore: Protein Sci., 22, 851-858 (2013). DOI: 10.1002/pro
Related Posts:
 Higher-Order Structure Stability Assessment of…
 Assessment of Aggregates in Antibody Drugs by SEC
 Monitoring of Aggregates and Degradation Products by…
 Analysis of CBN-Binding DNA Aptamer using CD Spectroscopy") Higher-Order Structure (HOS) Analysis of CBN-Binding…
Higher-Order Structure (HOS) Analysis of CBN-Binding… Higher Order Structure, Stability, and Similarity…
 Evaluation of Higher-Order Structure and Stability…