Introduction
Plastics have excellent properties such as lightness, strength, and high productivity, and are used in a wide variety of products. However, plastics are degraded by heat, light, water, and other factors, and it is not easy to visually determine the presence or absence of such degradation. Therefore, for quality control, research and development, it is extremely important to analyze plastics using a variety of different instruments to identify degradation.
In this report, the results of a multifaceted analysis of the degradation of food wrapping films due to heating are shown. Changes in molecular structure were analyzed using JASCO Fourier-transform infrared (FT-IR) and Raman spectrometers, changes in color using a JASCO UV-Vis spectrophotometer, and changes in mechanical properties using a texture analyzer (made by LAMY RHEOLOGY).
Experimental
Samples
Food wrapping films
- Polyethylene (PE) (heat resistant up to 110 ºC)
- Polyvinyl chloride (PVC) (heat resistant up to 130 ºC)
Samples were prepared without heating, and after 1, 2, and 3 weeks
of heating. An incubator set at 100 ºC was used for heating.
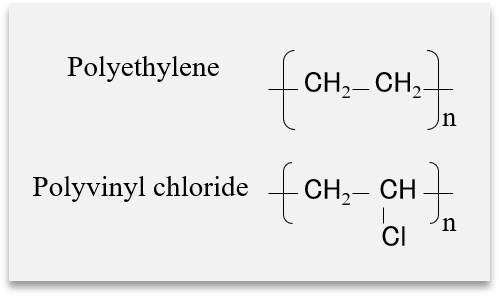
Fig. 1 Molecular structure of samples
System and Parameters
<FT-IR>
Instrument: FT/IR-4X FT-IR spectrometer
Accessories: ATR PRO 4X Single-reflection ATR, PKS-D1 Diamond crystal kit (high-throughput type)
Method: ATR
ATR crystal: Diamond
Resolution: 4 cm-1
Accumulations: 50
Fig. 2 FT/IR-4X FT-IR spectrometer
<Raman spectrometer>
Instrument: NRS-4500 Raman spectrometer
* Film sample secured using JASCO microscopic filter holder.
Laser wavelength: 532 nm
Objective lens: 100x
Laser power: 7.3 mW at sample surface
Exposure time: 15 sec
Accumulations: 1
Fig. 3 NRS-4500 Raman spectrometer
<UV-Vis spectrophotometer >
Instrument: V-750 UV-Vis spectrophotometer
Accessories: ISV-922 Integrating sphere unit, VWCD-960 Color evaluation (color diagnosis) program
Measurement range : 380 nm – 780 nm
Data interval : 1 nm
Bandwidth : 5 nm
Response: 0.05 sec
Scan speed: 1000 nm/min
Fig. 4 V-750 UV-Vis spectrophotometer
<Texture analyzer>
Instrument: TX-700 (made by LAMY RHEOLOGY)
Accessories: Fixture base table, Film compression fixture
Probe: Cylindrical probe (⌀2 mm)
Sensor: 50 N
Method: Compression
Speed: 0.5 mm/s
Distance: 10 mm
Sample detection: 0.1 N
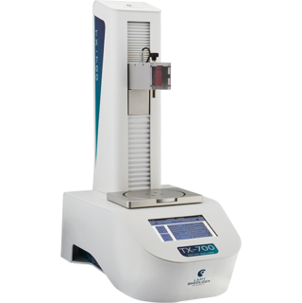
Fig. 5 TX-700 texture analyzer
Keywords
Thermal degradation, plastic, film, wrapping film, combined analysis, FT-IR, Raman spectrometer, UV-Vis spectrophotometer, texture analyzer
Results
PE wrapping film
<Appearance and texture>
The appearance of samples without heating, and after heating for 1, 2 and 3 weeks is shown in Figure 6. Although the samples became harder after heating, no changes in color or appearance were observed.
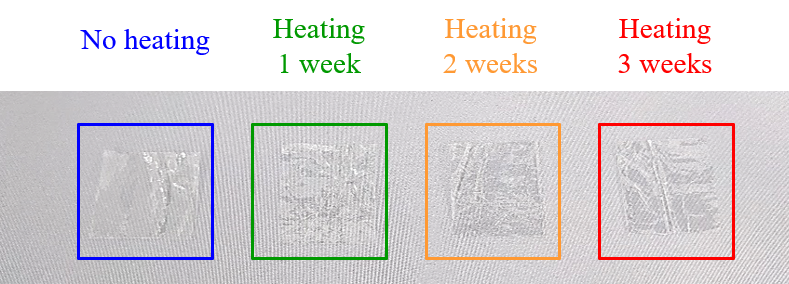
Fig. 6 PE wrapping films before and after heating
<UV-Vis spectroscopy>
Color evaluation using UV-Vis spectroscopy showed that the color was almost the same whether the sample was heated or not (Figure 7).
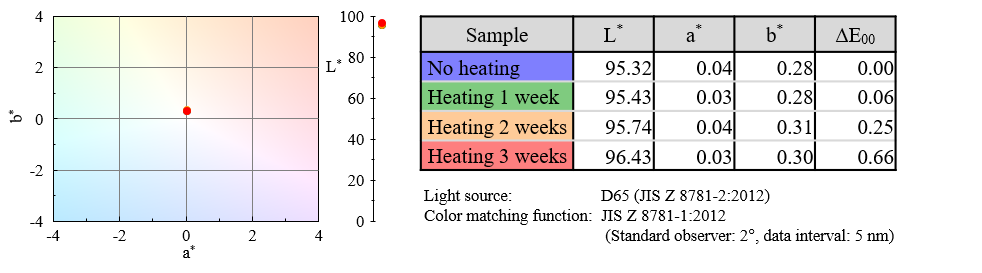
Fig. 7 Color coordinates for PE wrapping films
<FT-IR spectroscopy>
Figure 8 shows FT-IR absorption spectra of the samples, normalized using the band assigned to CH2 stretching at 2914 cm-1.
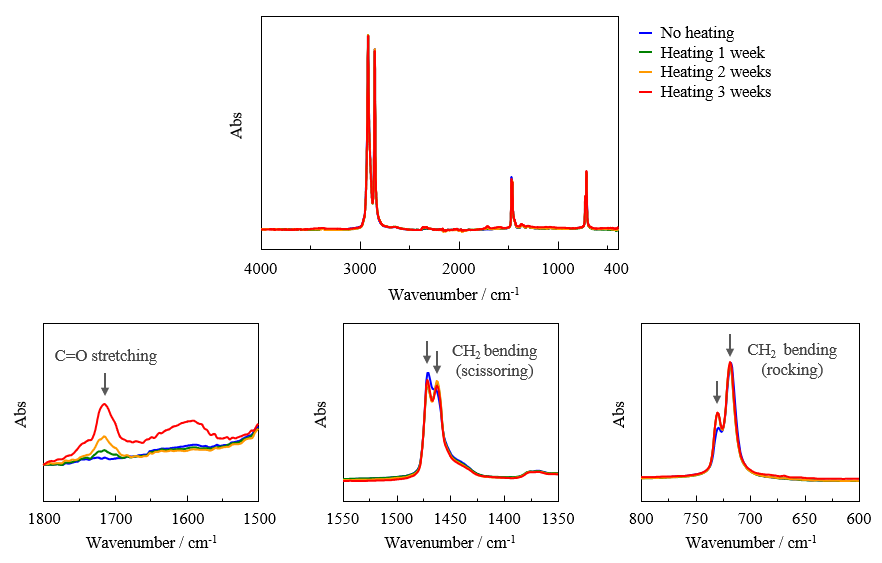
Fig. 8 IR spectra of PE wrapping films (enlarged spectra are in bottom)
In the spectra of the heated samples, a band assigned to C=O stretching vibrations at 1700 cm-1, which is generally associated with oxidative degradation, can be seen (lower-left panel). This band became stronger with increasing heating time, indicating the progression of oxidative degradation. In addition, since heating caused hardening of the film, the degree of crystallinity was evaluated. Crystalline and amorphous states can be identified based on splitting of the bands near 1470 and 1460 cm-1 assigned to CH2 bending vibrations (scissoring), and the bands near 730 and 720 cm-1 assigned to CH2 bending vibrations (rocking).1) Upon crystallization, these bands are known to split into two. Such splitting can be clearly observed for the heated films (lower-center and lower-right panels), indicating that heating increased the degree of crystallinity.
<Raman spectroscopy>
Using the JASCO Raman microscope, three points were measured for each PE sample and the average Raman spectrum was calculated in order to account for point-to-point variations. For ease of comparison, the spectra normalized by the 1438 cm-1 band are shown in Figure 9.
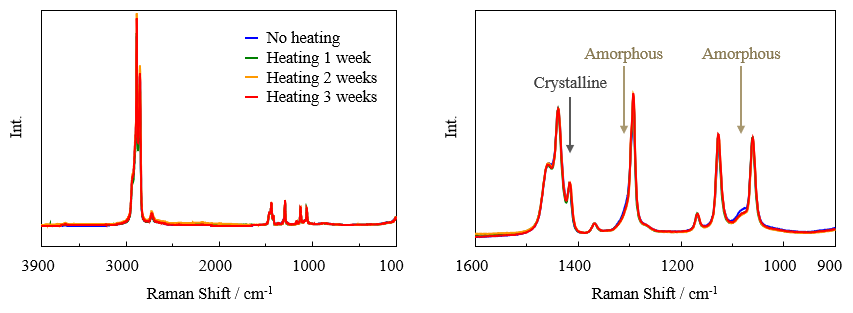
Fig. 9 Raman spectra of PE wrapping films (right panel enlarged)
A band associated with crystalline material is seen at 1416 cm-1, together with broad bands at 1080 and 1303 cm-1 associated with amorphous material.2) In the enlarged view in the right panel, it can be seen that heating causes an increase in the intensity of the peak due to crystalline material and a decrease in the intensity of the peaks due to amorphous material. This is consistent with the FT-IR results, indicating that the degree of crystallinity of the sample increases upon heating.
<Strength measurements>
In a puncture test, a probe is made to penetrate a test sample and the force required to achieve a certain penetration depth is measured. The sample was secured in the texture analyzer and the force and the penetration depth were measured. Depending on the heating time, changes between samples were observed in the rupture force and the depth of penetration. The results in Figure 10 show that heating reduced the depth of penetration by 50% or more, and that as the heating time increased, the strength decreased, making it easier to tear and harder to stretch the film.
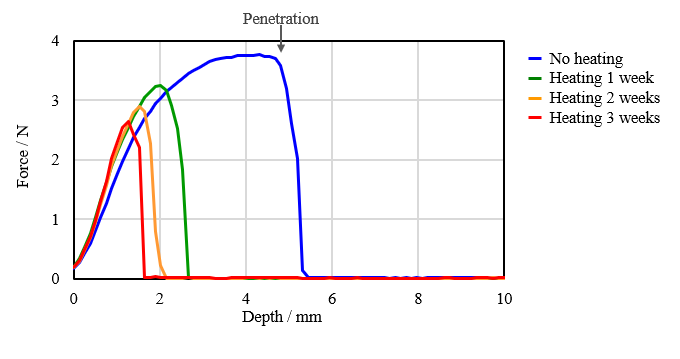
Fig. 10 Load-stroke curves for PE wrapping films during puncture tests
PVC wrapping film
<Appearance and texture>
The appearance of samples without heating, and after heating for 1, 2 and 3 weeks is shown in Figure 11. Unlike for PE, no change in hardness due to heating occurred, but a change in color was observed, and became more pronounced with increasing heating time.
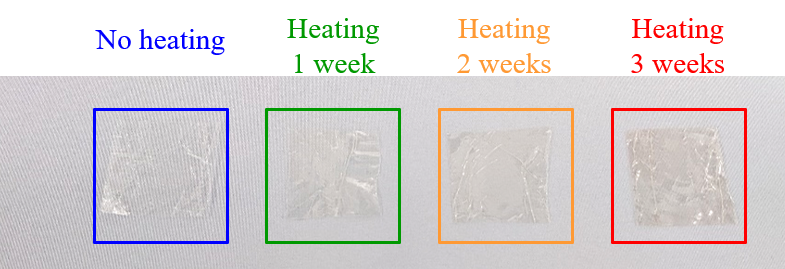
Fig. 11 PVC wrapping films before and after heating
<UV-Vis spectroscopy>
Since changes in color were observed, they were evaluated quantitatively by calculating the yellowness index (YI) 3) used to evaluate plastic degradation, as well as the color coordinates (L*, a*, b*) and color difference (ΔE00). The results showed that YI and b* became more positive with increasing heating time (Figure 12). It can be seen that the heating process gives the PVC film a yellowish to orange tint. The JASCO UV-Vis spectrophotometer thus allows accurate and objective color evaluation.
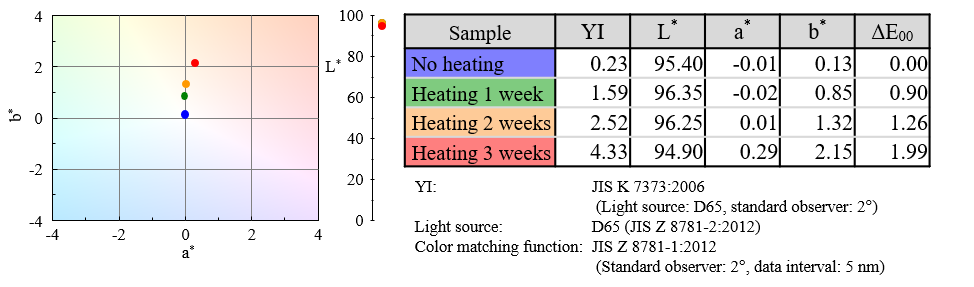
Fig. 12 Color coordinates for PVC wrapping films
<FT-IR spectroscopy>
Figure 13 shows FT-IR absorption spectra of the samples, normalized using the band assigned to CH2 stretching at 2926 cm-1. It can be seen that the band at around 608 cm-1 assigned to C-Cl stretching vibrations of PVC shifts to lower wavenumber due to heating. This shift may indicate the formation of conjugated double bonds. No significant effect of heating is observed for other bands.
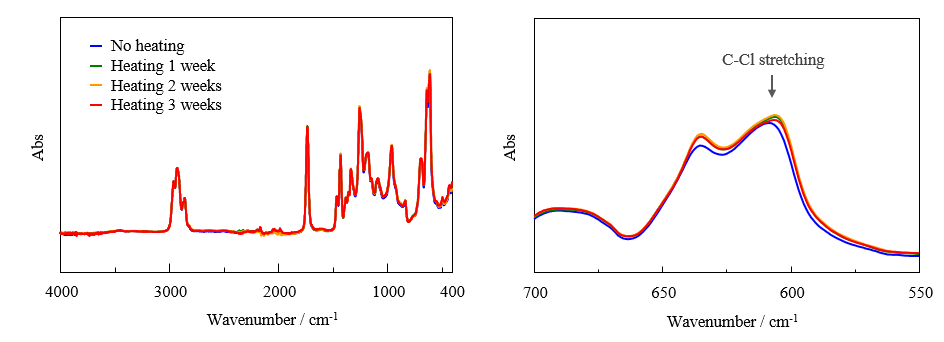
Fig. 13 IR spectra of PVC wrapping films (enlarged spectra are in right)
<Raman spectroscopy>
As with PE, a Raman microscope was used to perform measurements at three different points in each sample and the resulting Raman spectra were averaged in order to account for point-to-point variations. Since it was assumed that all bands for PVC would change after heating, the vertical axis of the spectra is not normalized.
The results in Figure 14 suggest that heating caused the formation of conjugated double bonds in PVC, whose electronic transition energy resonated with the excitation wavelength of the laser, resulting in enhancement of the Raman bands. Because the Raman intensity can change with the degree of focusing of the excitation light, it is not easy to quantify the changes based on the Raman spectra. However, the intensity of the C-Cl stretching vibration band at 600 to 700 cm-1 clearly decreases with increasing heating time, indicating that conjugated double bonds were most likely formed by elimination of Cl groups.
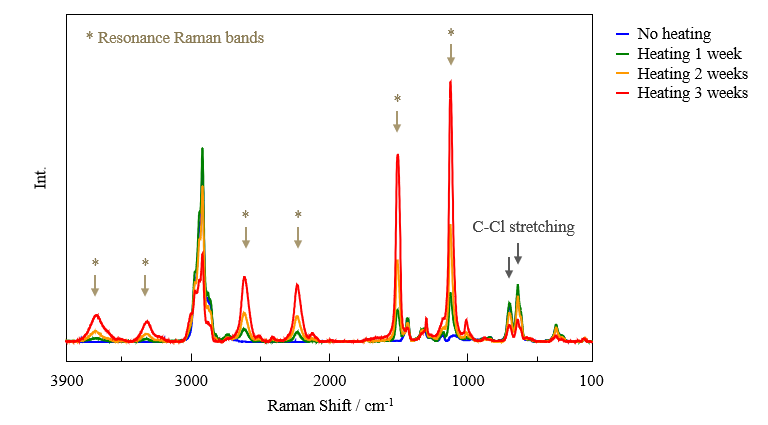
Fig. 14 Raman spectra of PVC wrapping films
Generally, compounds containing long conjugated chains confer color to a substance. The IR and Raman results shown in Figures 11 and 12, respectively, suggest that PVC changed to a molecular structure containing conjugated double bonds upon heating.
<Strength measurements>
The samples were secured in the texture analyzer and puncture tests were performed under the same conditions as those for PE Depending on the heating time, changes between samples were observed in the rupture force and the depth of penetration. The results in Figure 15 show that heating increased the depth of penetration, and that as the heating time increased, the strength increased, making the film harder to tear and easier to stretch. These results are opposite to those for PE films.
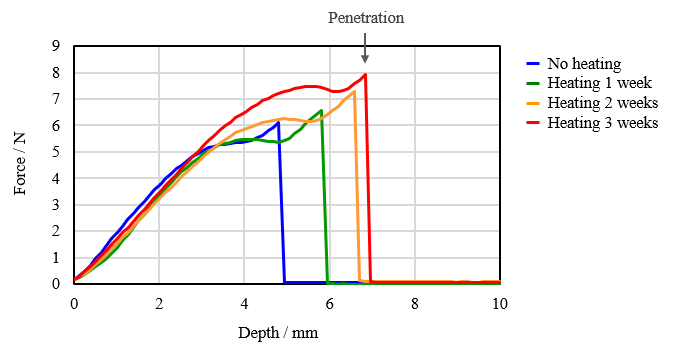
Fig. 15 Load-stroke curves for PVC wrapping films during puncture tests
Conclusion
A multifaceted analysis of food wrapping films showed that the type of degradation induced by heating was different depending on the material used. By changing the heating temperature and heating time, or by comparing data for various materials, it should be possible to select an appropriate material for each application.
The combined analysis described in this report allowed a wide range of information regarding the color, structure, and properties of the samples to be acquired. It may not be possible to obtain such detailed information using only a single analysis method. This multifaceted analysis approach is therefore considered to be useful for materials research and development, and also for quality control.
References
1)The Spectroscopical Society of Japan: “Infrared and Raman Spectroscopy”, Introduction to Spectroscopic Measurement Series, ISBN: 9784061569041, Kodansha Scientific Ltd., 6, 45 (2012).
2)T. Nishioka: “Infrared and Raman Spectroscopy of Polymers”, ISBN: 9784061543867, Kodansha Scientific Ltd., 381 (2015).
3)JIS K 7373, Plastics – Determination of Yellowness Index and Change of Yellowness Index (2006).


")
