Introduction
The methods of generating enantiomers are classified roughly into asymmetric synthesis, crystallization, enzyme reaction, and optical resolution by chromatography. In particular, normal phase chromatography with chiral stationary phases has been used in various fields such as pharmaceuticals, agrichemicals, natural products, biomolecules, and functional materials because of the cost efficiency. Recently, preparative SFC, which provides faster, higher-separation analysis and easier post handling of fractions than HPLC, has become a main stream as an efficient method of producing enantiomers in the drug discovery stage.
Nuclear magnetic resonance (NMR), X-ray diffraction (XRD), electronic circular dichroism (ECD), vibrational circular dichroism (VCD), and tandem mass spectrometry (MS/MS) are used for qualitative analysis and structural analysis of enantiomers of chiral substances. In general, these analyses require the sample amount from 1 to 100 mg. Circular dichroism (CD) spectroscopy is a useful technique because it doesn’t require a lot of sample amount and is easy to operate compared to other methods. It is possible to determine the absolute configuration of chiral molecules by comparing the calculated theoretical spectrum and experimental one.
In this presentation, we separated and fractionated enantiomers of chiral substances using semi-preparative SFC and applied the obtained enantiomer samples to spectra measurements by ECD and VCD spectrometers. Furthermore, we determined the absolute configuration of each enantiomer by calculating theoretical ECD and VCD spectra.
Experimental
Apparatus
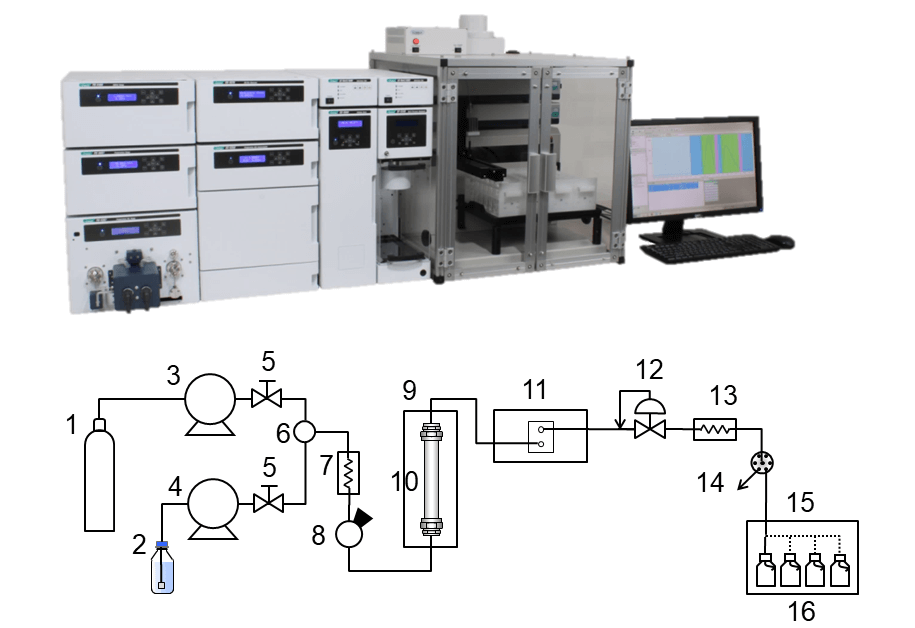
Figure 1 shows the appearance and schematic diagram of JASCO semi-prep SFC system used in this experiment. Figure 2 and 3 show the appearance of JASCO ECD and VCD spectrometers. Fractionated enantiomers from semi-prep SFC system were applied to spectral measurements by ECD and VCD systems.
Analysis Conditions
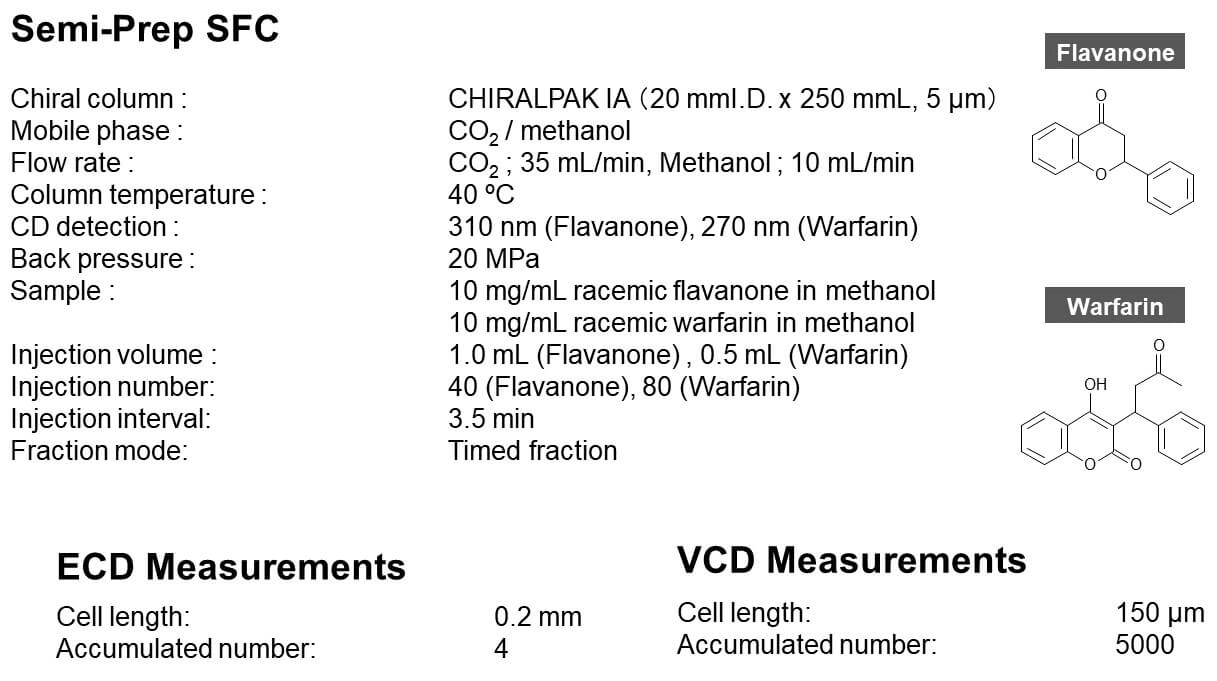
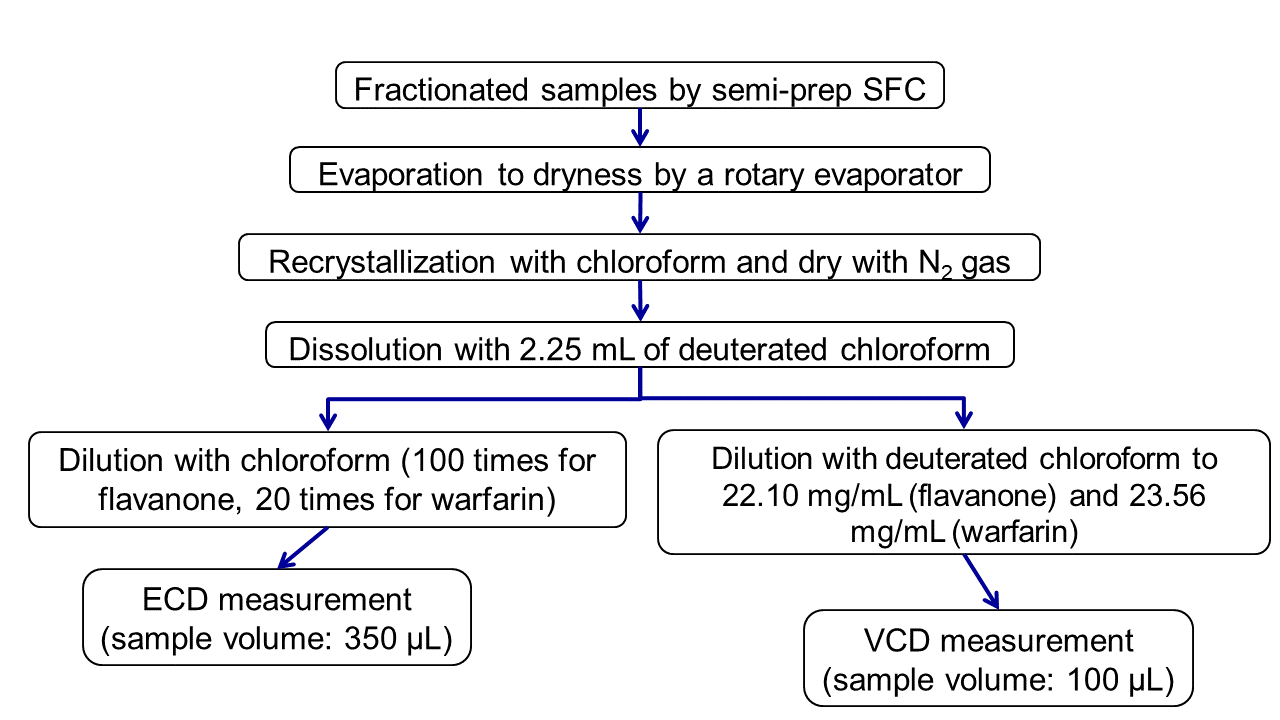
Pretreatment Procedure of fractionated enantiomers
Results
Results of Semi-Prep SFC
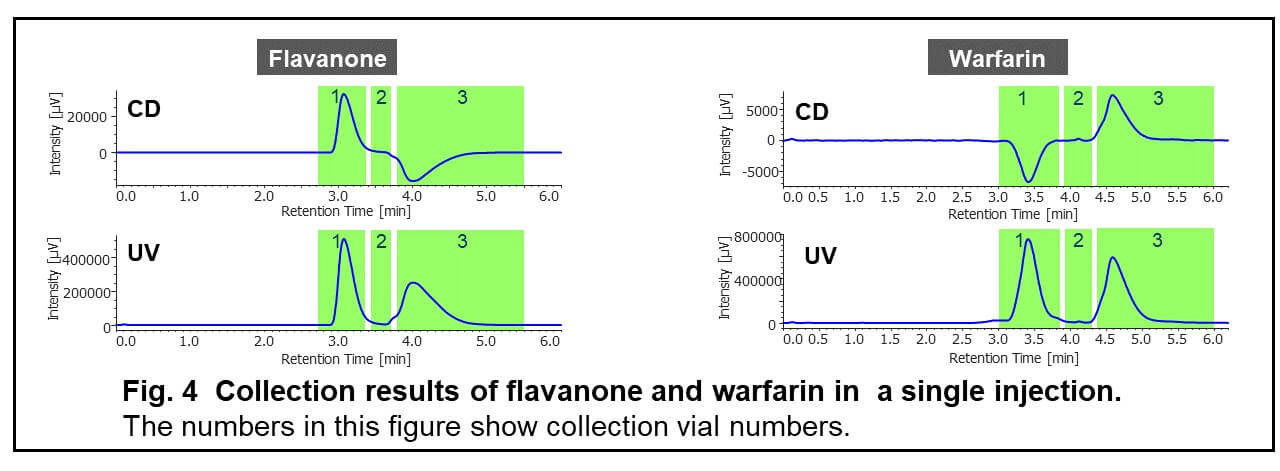
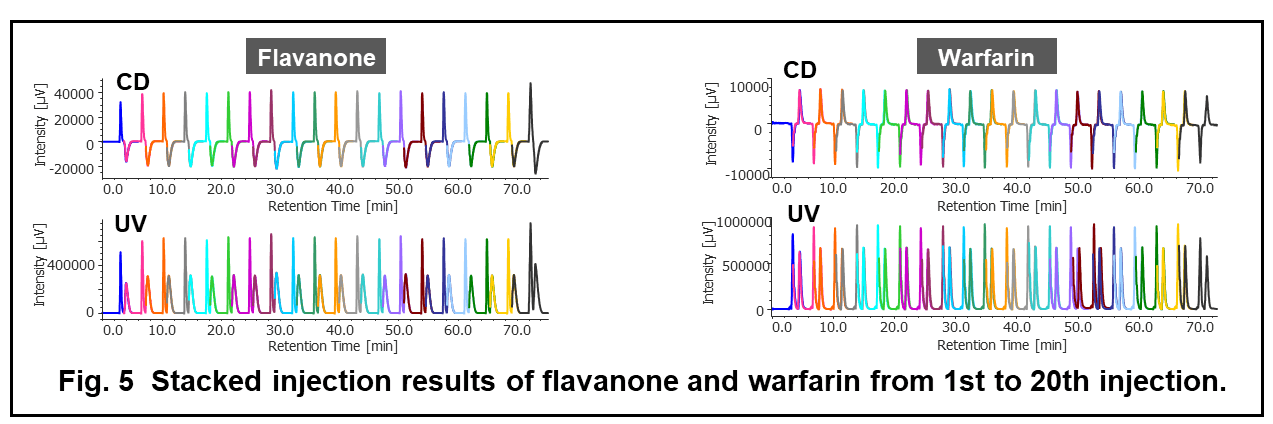
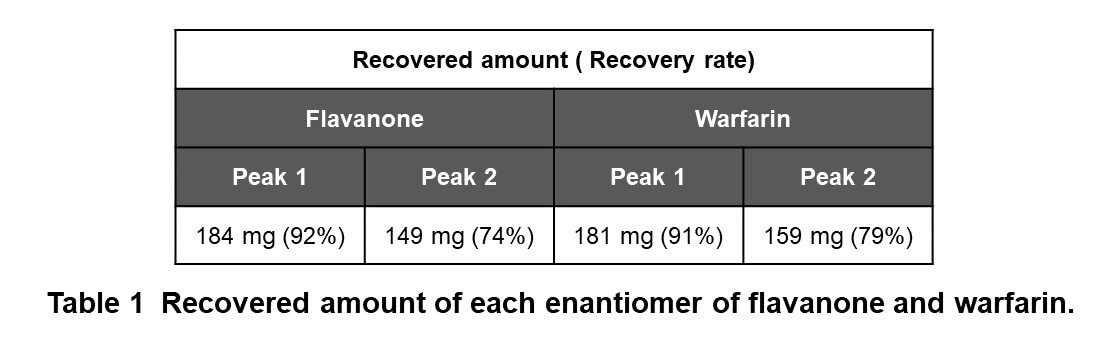
Figure 4 shows the collection results of flavanone and warfarin in a single injection. First and second peaks were collected into vial 1 and 3 by timed fraction. The range between those peaks was collected into another vial (vial 2) to enhance the purity of each peak. In order to obtain 100 to 200 mg of each enantiomer, repeat injections were executed (40 times for flavanone and 80 times for warfarin). The total run time and solvents consumption were reduced 1.6 times using stacked injection mode. Figure 5 shows stacked injection results of flavanone and warfarin, respectively. Table 1 shows the recovered amount (dry weight) of each enantiomer by semi-prep SFC. These enantiomer samples were applied to later ECD and VCD measurements.
Results of ECD and VCD Measurements
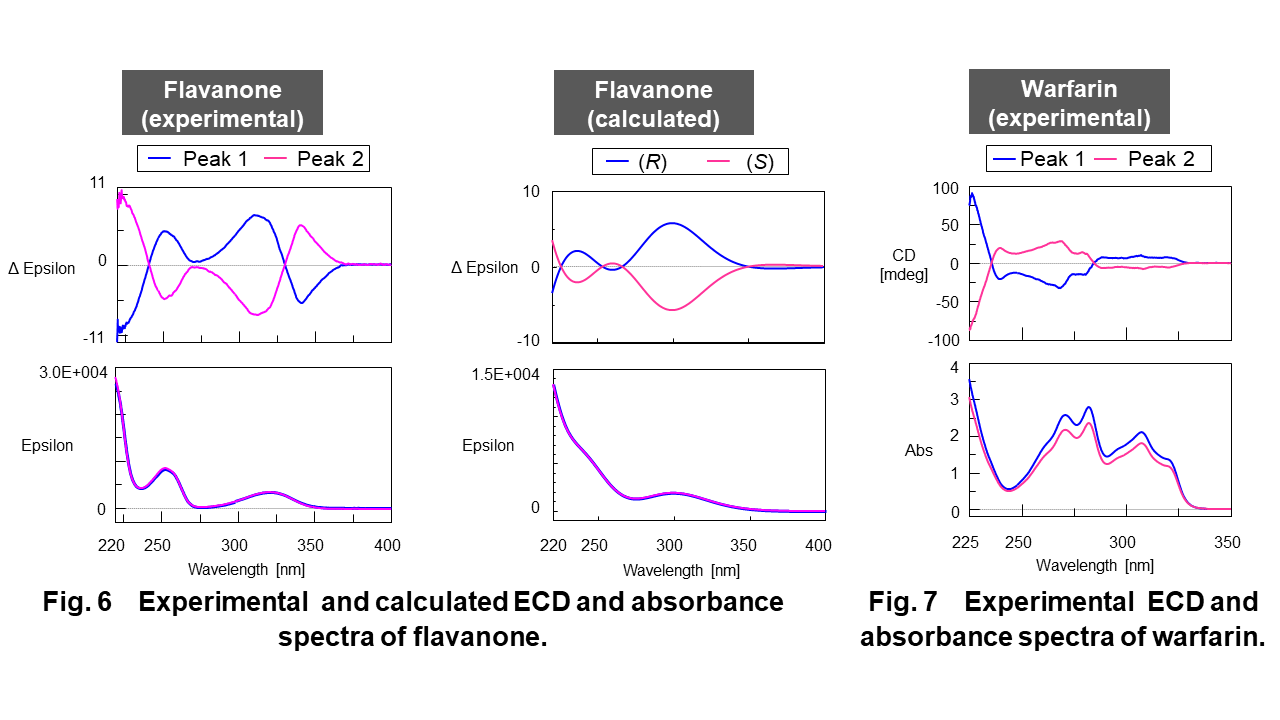
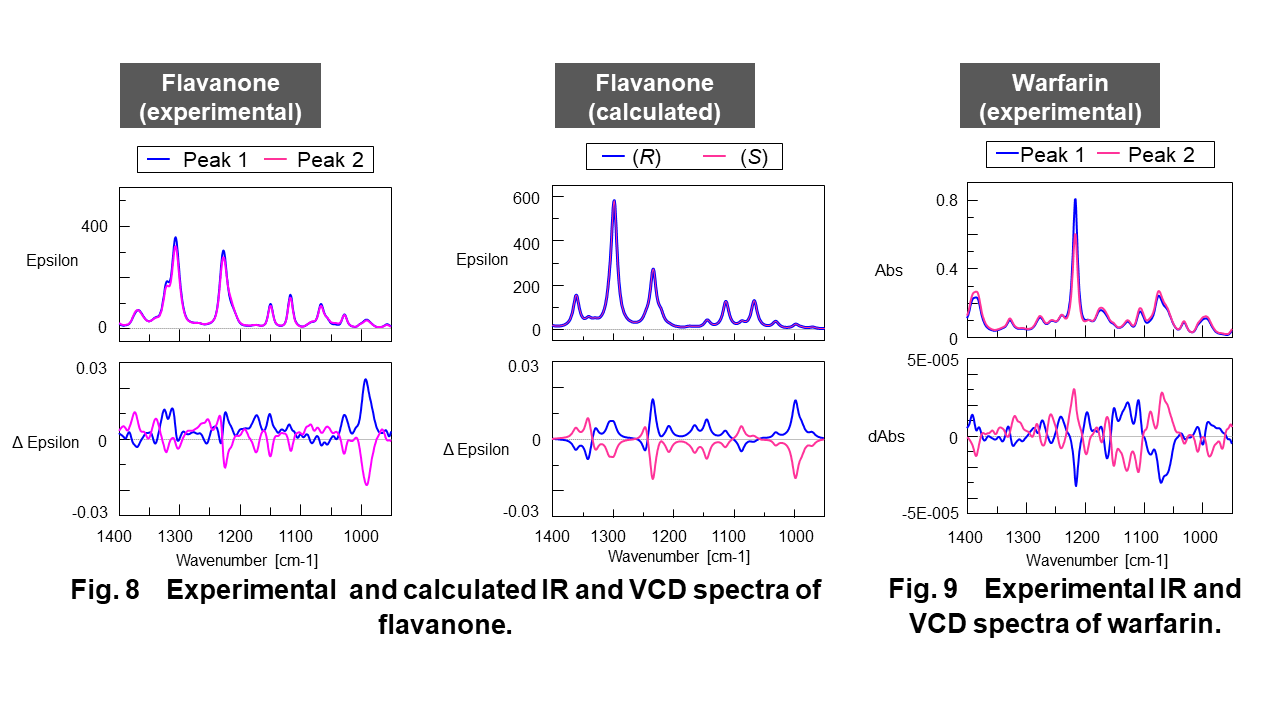
Figure 6 shows the experimental and calculated ECD and absorbance spectra of flavanone and Figure 7 shows the experimental ECD and absorbance spectra of warfarin. Figure 8 shows the experimental and calculated infrared (IR) and VCD spectra of flavanone and Figure 9 shows the experimental IR and VCD spectra of warfarin.
As shown in these figure, the symmetrical ECD and VCD spectra were obtained in experimental spectra, respectively. The trace of calculated ECD and VCD spectra (DFT and TD-DFT, B3PW91/CC-pVDZ level) of flavanone significantly corresponded to those of experimental spectra. Compared to calculated spectra, the enantiomers from peak 1 and 2 can be identified to R form and S form of flavanone.
Conclusion
– The total run time and solvents consumption by semi-prep SFC were reduced 1.6 times using stacked injection mode (2.5 hours for 150 to 180 mg of each flavanone enantiomer).
– The symmetrical ECD and VCD spectra were obtained in experimental spectra.
– The trace of calculated ECD and VCD spectra of flavanone were significantly corresponded to those of experimental spectra and the enantiomers from peak 1 and 2 can be identified to R form and S form of flavanone.
– The enantiomer sample amount required for ECD and VCD measurements was 3 to 4 mg (twice injection in semi-prep SFC system provide enough sample amount).
Acknowledgements
The authors are grateful to prof. M. Uchiyama from the University of Tokyo for the support on the DFT and TD-DFT calculations.
References
Poster session at SFC 2018, Strasbourg, France
Satoe Iijima, Jiawei Xu, Kengo Yoshida, Keisuke Watanabe, Yoshiro Kondo, Satoko Suzuki, Masao Bounoshita, Yasuyo Sato, Miki Kuwajima
JASCO Corporation, 2967-5 Ishikawa-machi, Hachioji, Tokyo 192-8537
1. N. M. Maier, P. Franco, W. Linder, J. of Chromatography A, 906, 3-33 (2001).
2. L. Miller, J. of Chromatography A, 1250, 250-255 (2012).
3. M. A. Muñoz, M. A. Bucio, P. Joseph-Nathan, Nat Prod Commun, 8 (8), 1075-1078 (2013).
Related Posts:
 Structural Analysis of Chiral Samples with Multiple…
 Increased Productivity of Chiral Separation in…
") Chiral preparative separation of warfarin using…
Chiral preparative separation of warfarin using… Rapid Column Screening for Chiral Separation by Parallel SFC
 Determination of Absolute Configuration of Molecules…
 Analysis of Flurbiprofen and Ketoprofen by SFC-PDA…