Introduction
The simple methods for analysis of Brominated Flame Retardants in the mid-infrared (mid-IR) region and in far-infrared (far-IR) region were reported in the previous article, and also it was suggested that the quantitative analysis in the mid-IR region would be possible to some extent. This time, quantitative analysis results by the calibration curve in far-IR region were compared with the results in the mid-IR region in order to confirm the usefulness of analysis by Far-IR spectroscopy. Based on such calibration curve, PBDE (Decabromodiphenylether) of electric and electronic part plastics were quantitatively analyzed.
Experimental
As the samples, electric and electronic part plastics were broken into pieces of a few millimeters and formed it into a film of 1 mm in thickness, 10 mm in size with a hot press (heated and pressed). The ATR method was used for the measurement in the mid-IR region and the transmission method was applied for the far-IR region. The full vacuum type of model FT/IR-6000 series (for far-IR) was used for the measurement. Both the measurements in the mid-IR region and the one in far-IR region are possible only by changing the beam splitter and detector. In the far-IR region, it is possible to perform even the measurement of colour plastics including a large amount of inorganic compounds and also black plastics which are normally difficult with IR spectrometers and Raman spectrometers. The calibration curve was generated by utilizing the second derivative of absorption peak, 355cm-1 of spectra of polystyrene containing PBDE. In this case the correction due to film thickness was implemented.
FT/IR -6800 FTIR spectrometer
Results
Figure 1 shows the far-IR spectra of polystyrene (Black) containing 0 %, 15 % and 30 % of Brominated Flame Retardants. There is no absorption peaks of polystyrene in far-IR region. The peaks of the antimony oxide added to improve the flame resistance are indicated by the red arrow. Since the presence of flame retardants can be confirmed clearly by the absorption peaks, it is very easy to analyze. In addition, it is possible to distinguish whether the sample contains the regulated Br compounds or the non- regulated ones.
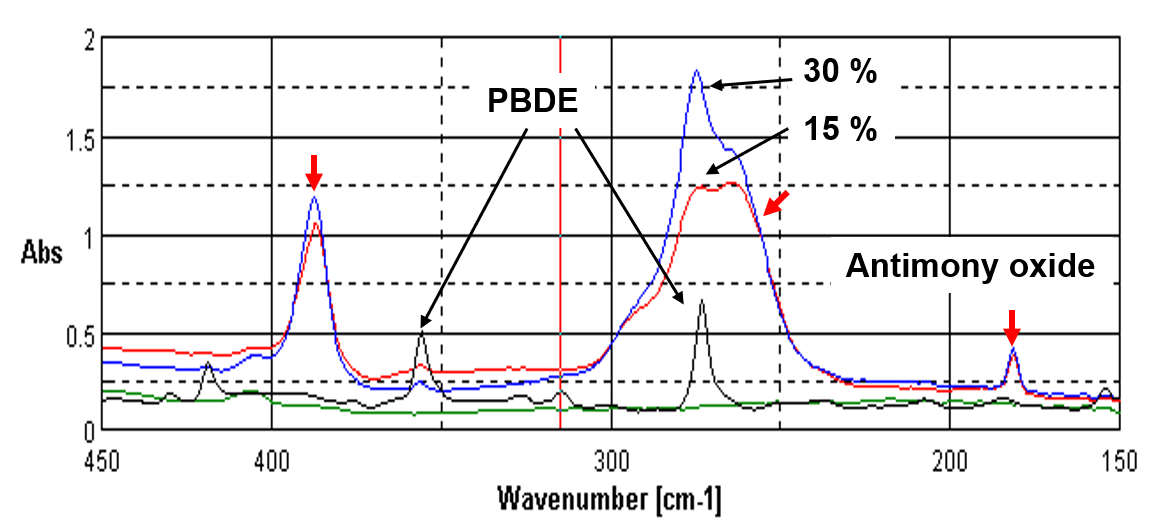
Figure 1. Far-IR spectra of polystyrene containing PBDE
Figure 2 is an example of the calibration curve in the far-infrared region. It is generated by one-peak method with the thickness correction.
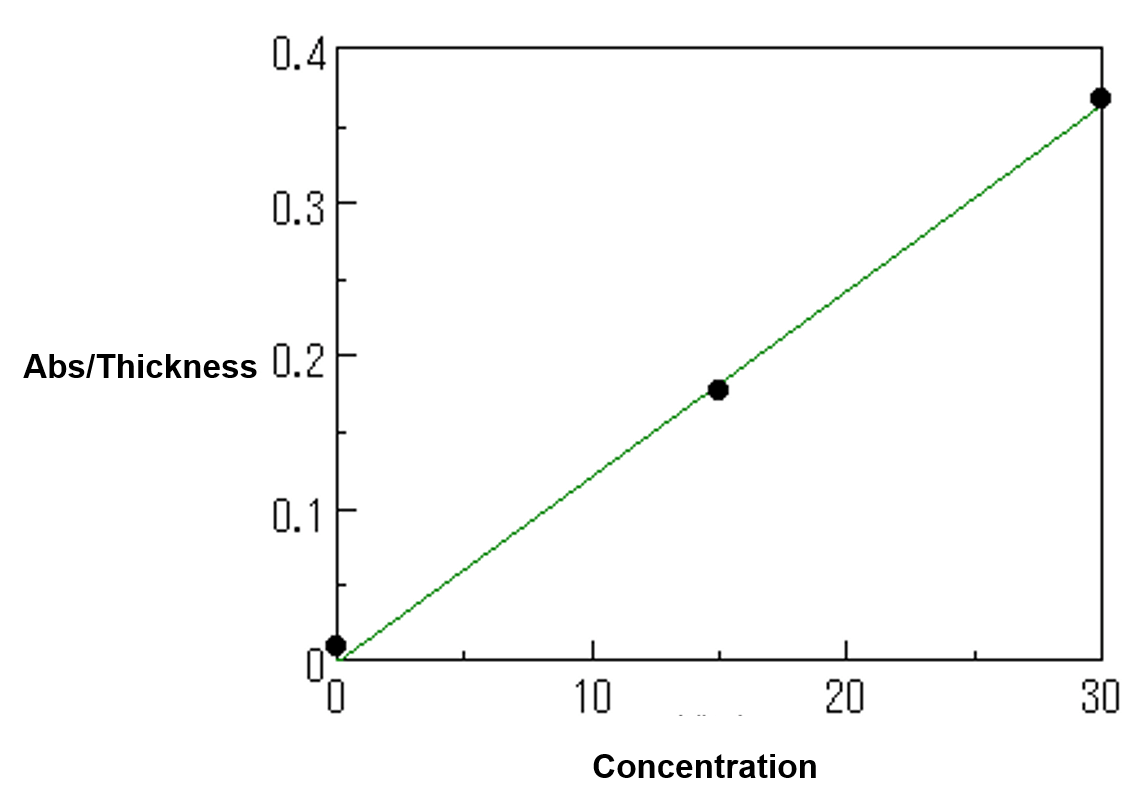
Figure 2. Calibration curve by far-IR spectra
Figure 3 is another example of spectra of electric and electronic parts made of polystyrene obtained by the same method. Even if A and B look similar as the black plastics containing antimony oxide, B has three peaks due to PBDE, while A shows only one peak at the same three wavenumbers. A can be considered as decomposition product or isomer. C is transparent brown polystyrene and contained neither PBDE nor antimony oxide.
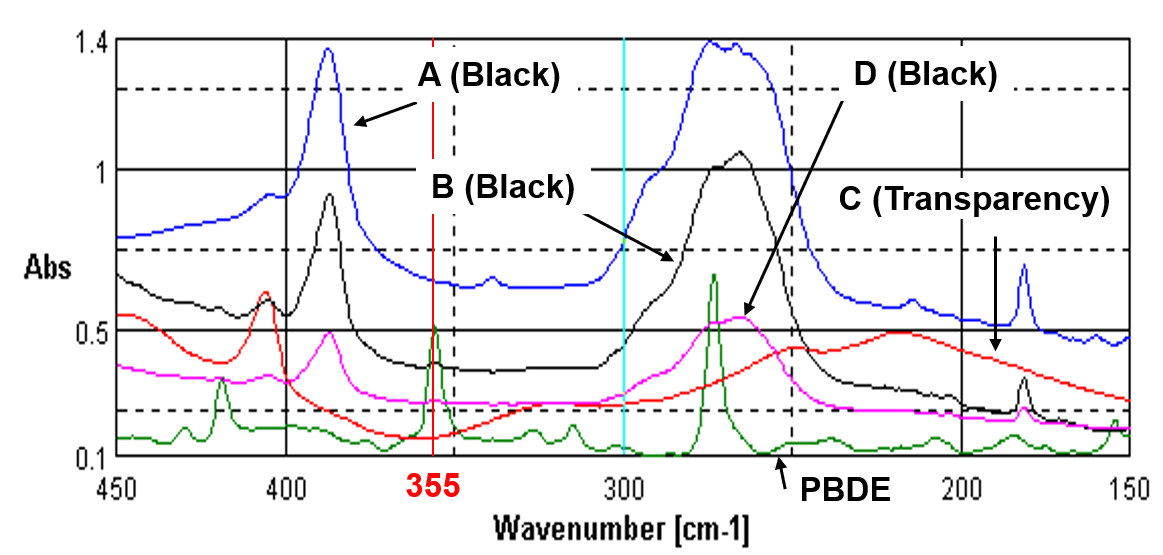
Figure 3. Far-IR spectra of electric and electronic parts made of polystyrene
Table 1. Result of quantitative analysis
| Far-IR (Transmission) | |
|---|---|
| Sample A (Black) | 0.00 % |
| Sample B (Black) | 12.8 % |
| Sample C (Transparency) | 0.02 % |
| Sample D (Black) | 5.12 % |


