Introduction
Hexavelent chromium (Cr(VI)) is a significantly hazardous material regulated by OSHA with reference to 29CFR parts 1910 and 1915, by RoHS directive, and by IEC-62321 , which strictly controls and regulates the use of specific hazardous materials in a wide range of industrial processes as well as electrical and electronic products.
This application note describes the extraction and quantitative measurement of hexavalent chromium residue from the treatment of two samples of screws using a chromogenic reaction and UV-Visible spectroscopy.
The chromium from two steel screws (Figure 1) was extracted using hydrothermal extraction. The screws were placed in 25 mL of purified water and heated at 80° C for 30 minutes. These conditions are subject to change depending on the sample type and requirements of regulatory compliance.
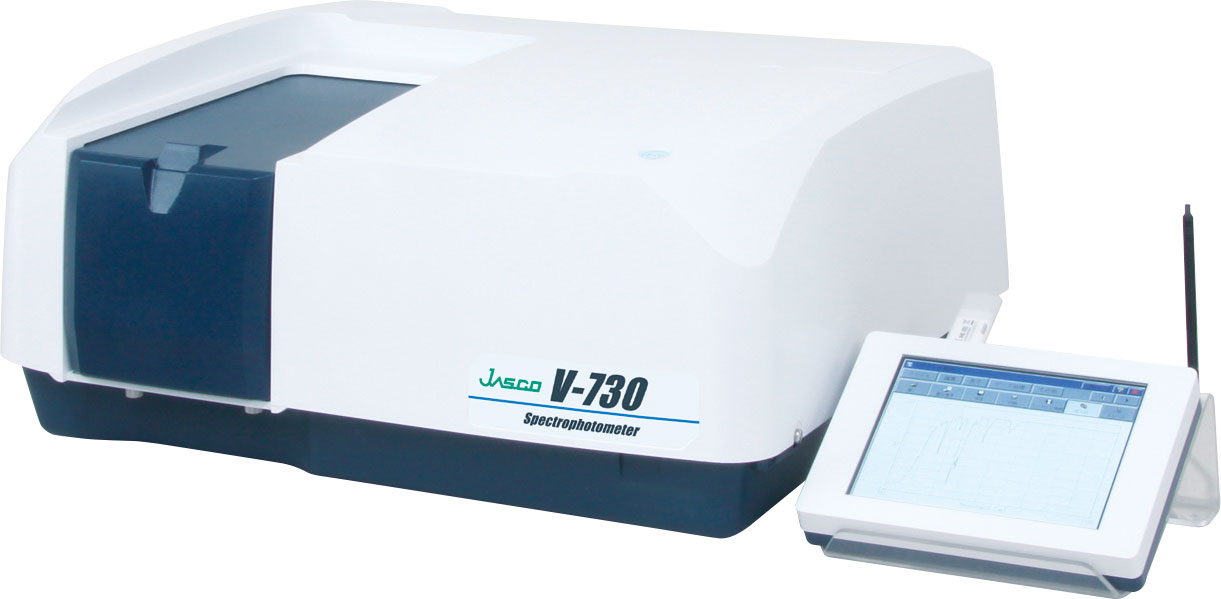
V-730 UV-Visible spectrophotometer
Experimental
The chromium from two steel screws (Figure 1) was extracted via Hydrothermal Extraction. The screws were placed in 25 mL of purified water and heated at 80 degrees Celsius for 30 minutes. These conditions are subject to change depending on the chromium coatings for a particular screw.
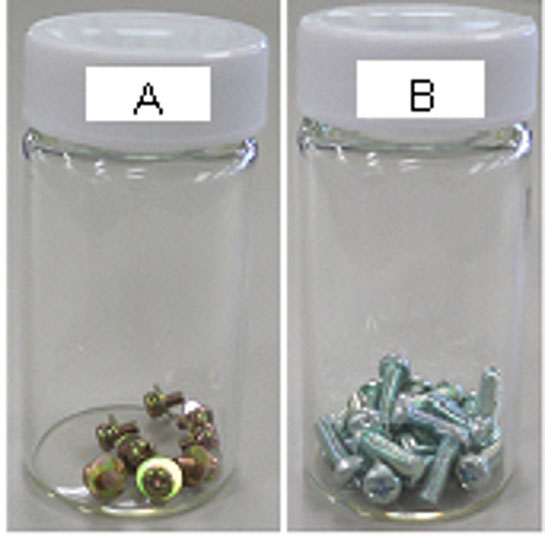
Figure 1. Sample screws
After hydrothermal extraction, the screws were removed from the extraction liquid which was cooled to room temperature. The chromogenic reagent (Kyoritsu Chemical-Check Lab) was added to the extraction liquid, stirred for 1 minute, and the left to stand for 5 minutes. Turbidity was observed after 5 minutes. Figure 2 shows the sample pre- and post-filtration. Measurements were obtained on both samples for comparison using the following measurements parameters.

Figure 2. Screw samples after the chromogenic agent was added to the extraction solutions and pre- (left) filtration and post (right) filtration of the solutions
Keywords
UV-Visible/NIR, Hexavalent Chromium, IEC-62321, 29CFR part 1910, 29CFR part 1915
Results
The spectra of the samples before and after filtration are illustrated in Figure 3. The spectrum of the sample before filtration shows a higher baseline, which is due to the dispersion of interfering substances in the solution. A three wavelength quantitative analysis was performed to confirm the effects of the interfering substances. Table 1 shows the results of the peak height calculations. Regardless of the pretreatment, almost identical results were obtained.
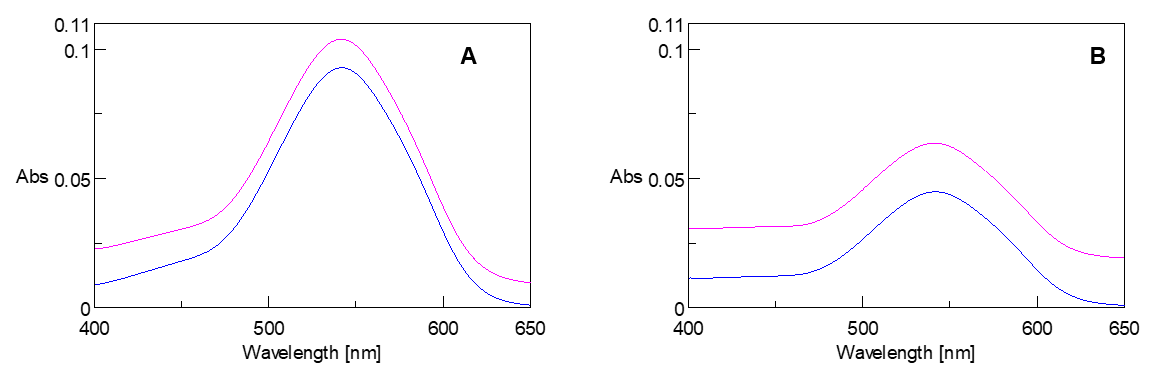
Figure 3. Absorption spectra of samples A and B before (purple) and after (blue) filtration
Table 1. Peak height calculation results of screw samples A and B.
| Sample A | Sample B | ||||
| Before filtration | After filtration | Before filtration | After filtration | ||
| 1 Wavelength | Abs at 542 nm | 0.10393 | 0.09288 | 0.06365 | 0.04482 |
| 3 Wavelength | Peak height: 542 nm Base: 402, 635 nm |
0.08782 | 0.08765 | 0.03932 | 0.03915 |
Three wavelength quantitative analysis was examined on the peak height calculated with peak wavelength at 402 nm and a base wavelength at 635 and 542 nm. The calibration curve obtained by the diphenylcarbazide method in the previous article was applied to this quantitative analysis. Table 2 shows the concentration of Cr (VI) for samples A and B using a two-sided 95% confidence interval and both samples A and B fall within ±0.005 mg/L of the confidence interval.
Table 2. Quantitative results of Cr(VI) in screw samples.
| Sample A | Sample B | ||
| Before filtration | After filtration | Before filtration | After filtration |
| 0.135 ± 0.006 mg/L | 0.135 ± 0.006 mg/L | 0.059 ± 0.005 mg/L | 0.059 ± 0.005 mg/L |


