Introduction
Chromium is widely used with other metals such as iron and steel, chromium alloy, and refractory products, it is also used in the plating, tanning, and pigment industries. While chromium compounds are very useful, chromium ions are harmful to the human body. Therefore, manufacturers using chromium require careful handling and rapid quantitative determination for user and product safety. The most widely used quantitative method for hexavalent chromium is a diphenycarbazide absorption method using a UV-Visible spectrophotometer.
This article examines the detection and quantitation limits of chromium using a JASCO V-730 spectrophotometer. Calibration curves were created using a chromogenic kit from a commercial reagent manufacturer for simple quantitative determinations.
V-730 UV-Visible Spectrophotometer
Experimental
To prepare the stock standard solution, K2Cr2O7 was dried at 150°C for one hour then placed in a desiccator. 8.79 mg of the K2Cr2O7 was dissolved in 100 mL water and 80.4 mL of this solution was diluted to 100 mL in a 100 mL flask, producing a 25 mg/L chromium standard stock solution. This was further diluted to create another standard stock solution of 0.25 mg/L.
These two stock solutions were used to prepare Cr (VI) standards for the calibration curves with the following concentrations: 1.5, 1.0, 0.5, 0.25, 0.125, 0.060, 0.040, 0.020, 0.010, 0.0075, 0.0050, 0.0025, 0.0010, and 0.0000 mg/L.
The chromogenic reaction of the chromate solutions was allowed to equilibrate at room temperature (21°C). One package of the reagent used for Cr (VI) water analysis was added to the calibration curve solutions immediately after opening since the reagent is hygroscopic and deteriorates with time. The bottle of the analysis solution was mixed by hand for approximately 60 seconds until completely dissolved. Incomplete mixing does not provide a proper chromogenic reaction and will have an effect on the absorbance values obtained for the reagent reaction. Granular reagent will remain even if the reagent dissolves perfectly in the solution. The remaining precipitates to the bottom of cell and does not have any effect on the absorption measurements.
25 mL of a 0.5 mg/L Cr (VI) solution was prepared to evaluate the time required for the complete reaction of the chromogenic reagent using a time course absorption measurement from the chromogenic reaction (Figure 1). The chromogenic reagent was added to the solution right after opening, mixed for one minute, and the reaction time at the absorption maximum of 540 nm was measured. Here, 90 seconds was assumed as the time delay after addition of the reagent until starting the absorption measurement. The chromogenic reaction was completed approximately 150 seconds after starting the time based measurement (4 minutes after addition of the reagent). Further, the reagent color became stable 210 seconds after starting the measurement (5 minutes after addition of the reagent).

Figure 1. Time course measurement of the chromogenic reaction at 540 nm (left) and color change of the reaction before and after the addition of the reagent (right).
Keywords
UV-Visible/NIR spectrophotometer, Quantitation, hexavalent chromium, chromogenic reaction,
Results
Figure 2 illustrates the change in the absorption maximum upon the addition of the reagent to the chromium standard solutions.
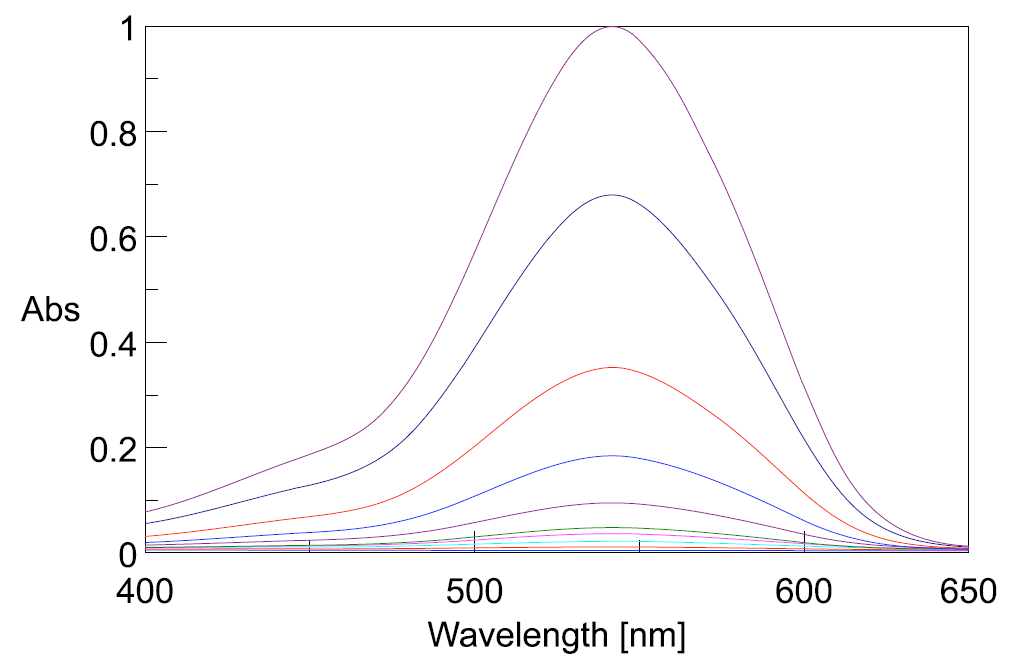
Figure 2. Absorption spectra of varying Cr (VI) standard solutions.
Fluctuation in the spectral baseline was observed for the Cr (VI) solution concentrations between 0.01 mg/L and 0.001 mg/L. Thus, the calibration curves were created based on the peak height at 542 nm using peak baseline points at 402 and 635 nm. The calculated peak height values are shown in Table 1. The quantitation limit of the calibration curve created with the complete calibration set was 0.09 mg/L. Furthermore, when the calibration curve was created using only the data from the solutions in the range between 0.01 mg/L and 0.001 mg/L, a quantitation limit of 0.0025 mg/L was obtained with the truncated data set (Figure 3).
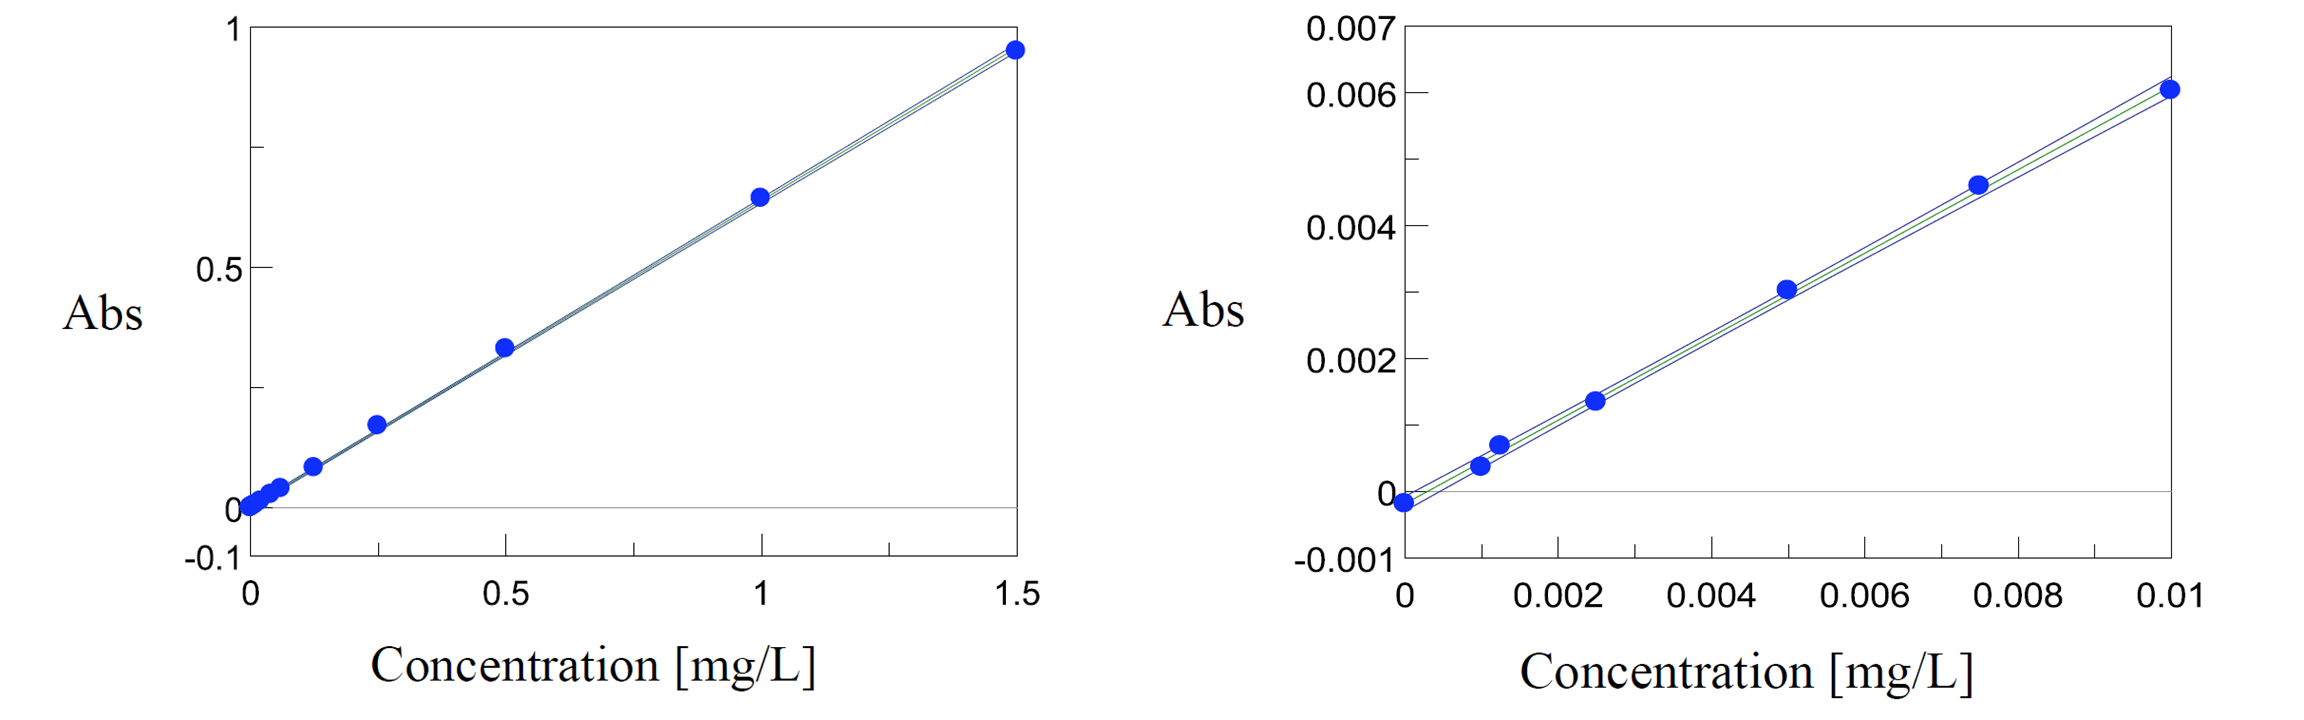
Figure 3. Calibration curves for standard concentrations (left) and the shortened concentration range (right).
Table 1. Chromium standard concentrations and calculated absorptions.
| Concentration (mg/mL) | Absorbance | Concentration (mg/mL) | Absorbance |
| 0 | -0.00019 | 0.02 | 0.013 |
| 0.001 | 0.00036 | 0.04 | 0.02695 |
| 0.00125 | 0.00068 | 0.06 | 0.03932 |
| 0.0025 | 0.00134 | 0.125 | 0.0827 |
| 0.005 | 0.00302 | 0.25 | 0.17008 |
| 0.0075 | 0.00459 | 0.5 | 0.33018 |
| 0.01 | 0.00603 | 1 | 0.64278 |
| — | — | 1.5 | 0.94904 |
Conclusion
This article demonstrates the excellent sensitivity of the JASCO V-730 by quantifying chromium concentrations between 0.09 mg/L to 1.5 mg/L, as well as between 0.01 mg/L and 0.001 mg/L.


