Introduction
Proteases are responsible for breaking down biological molecules into smaller polypeptide chains through hydrolysis. Upon hydrolysis of the substrate (methylcoumarin-amide [MCA]), 7-amido-4-methylcoumarin (AMC) and a water-bound trypsin peptide are produced. Trypsin is a protease that is commonly used in assays to determine the enzymatic activity of a molecule. After cleavage of the substrate via hydrolysis, the trypsin activity can be measured by monitoring the fluorescence intensity at 440 nm of the isolated product, AMC as a function of time. This section shows the example of trypsin activity evaluation by fluorescence peptide MCA substrate.

Boc-Gln-Ala-Arg-MCA Isolation AMC
Figure 1. The hydrolysis reaction of MCA by protease
[Samples]
– Intensity standardization sample: 50 μmol/L AMC solution
– Enzyme solution: 10 nmol/L Trypsin bovine pancreas typeVIII, 50 mmol/L Tris-HCl, 0.15 mol/L NaCl, 1.0 mmol/L CaCl2, 0.1 mg/mL BSA
– Substrate solution: Boc-Gln-Ala-Arg-MCA solution
(Last concentration: 0.5, 1, 2.5, 5, 10, 20, 40 μmol/L)
Experimental
[Measurements]
1) Fluorescence-spectrum measurement of AMC Excitation and the Fluorescence spectrum of 50 μmol/L AMC were measured (Figure 2). It turns out that the maximum emission wavelength from this result is 440 nm.
[Measurement parameters]
Excitation wavelength: 360 nm (fluorescence spectrum)
Emission wavelength: 440 nm (excitation spectrum)
Bandwidth (excitation): 5 nm
Bandwidth (emission): 10 nm
Scanning speed: 500 nm/min.
Data interval: 1 nm
Response: 0.5 sec.
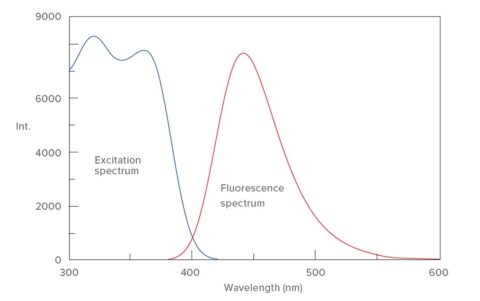
Figure 2. Excitation/Fluorescence spectra of AMC Sensitivity: 200 V
2) Vertical axis switching (into concentration from fluorescence intensity)
Intensity standardization was performed in order to change the vertical axis into the numerical value equivalent to concentration. 50 μmol/L AMC solution of 0.5 mL is dropped at enzyme solution 2.5 mL. Fluorescence intensity of last
concentration of 8.333 μmol/L AMC solution was set to 8333 μmol/L AMC solution.
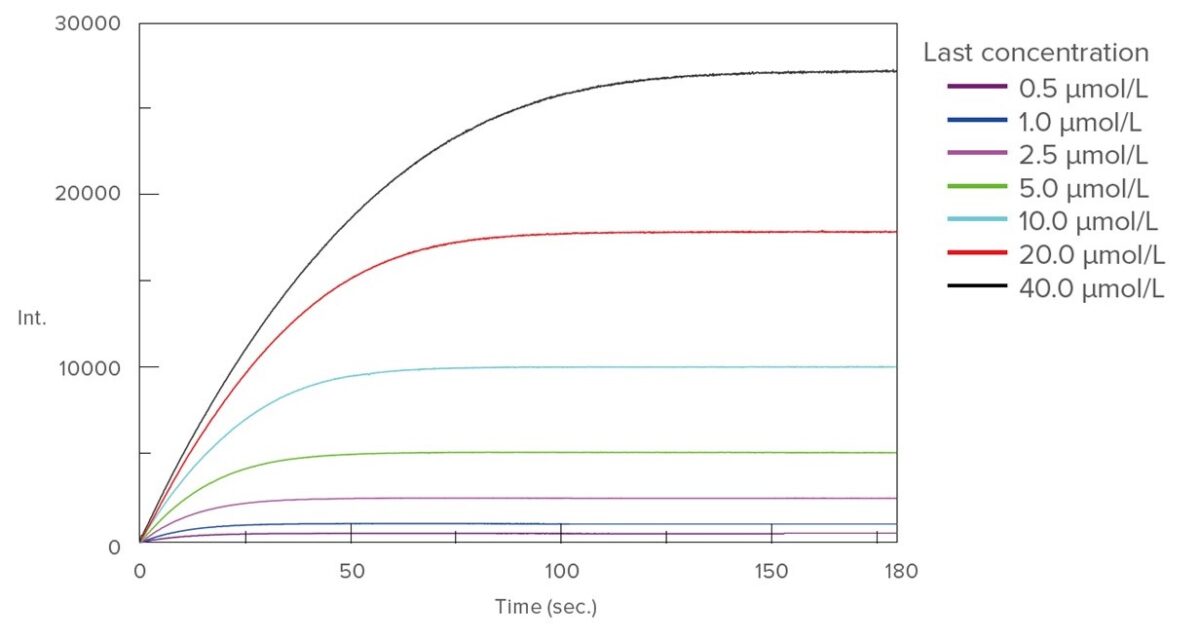
3) Enzyme activity measurement substrate solution 0.5 mL of each concentration was dropped at enzyme solution 2.5 mL, and time course measurement of the fluorescence intensity of the isolation AMC was performed to it. The results are shown in Figure 3.
[Measurement parameters]
Excitation wavelength: 360 nm
Emission wavelength: 440 nm
Bandwidth (excitation): 5 nm
Bandwidth (emission): 10 nm
Data interval: 0.1 sec.
Response: 0.1 sec.
Sensitivity: 200 V
[Analysis]
Each initial velocity was calculated from inclination of the time variation data of each substrate concentration, and the Lineweaver-Burk plot was performed (Figure 4). Km=5.99 and Vmax=35270 nmol/L·min-1 were obtained from this result.
[Calculation results]
Calculation method: Lineweaver-Burk Plot
Vmax: 35270
Km: 5.99
1/v = 0.000170·1/[S] + 0.0000284
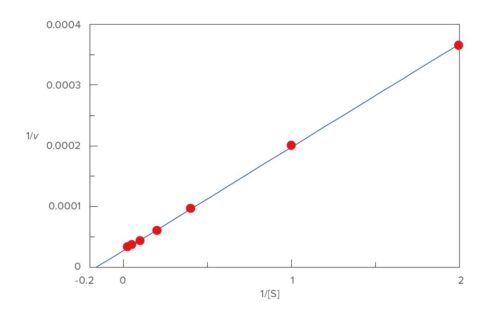
Figure 4. Lineweaver-Burk plot
Related Posts:
 In-situ Raman Monitoring for Flow Synthesis of Peptide Drugs
 Fluorescence Observation and Foreign Materials…
 Estimation of Optimal Excitation Wavelength for…
 Denaturation assessment of apo α-lactalbumin by…
 Prediction of Liposome Phase Transition Temperature…
 Avoiding Interference from Fluorescence Signal by…