Introduction
Flow synthesis is attracting attention as an effective method for efficient development of high-quality drugs. To ensure proper management of the flow-synthesis process, real-time multi-faceted analyses are essential. We have previously developed a measurement system that uses a compact Raman spectrometer capable of in-situ measurements to monitor the synthesis process for small organic compounds in real time [1]. In this study, we conducted experiments aimed at applying this monitoring technique to the synthesis of more complex peptide drugs.
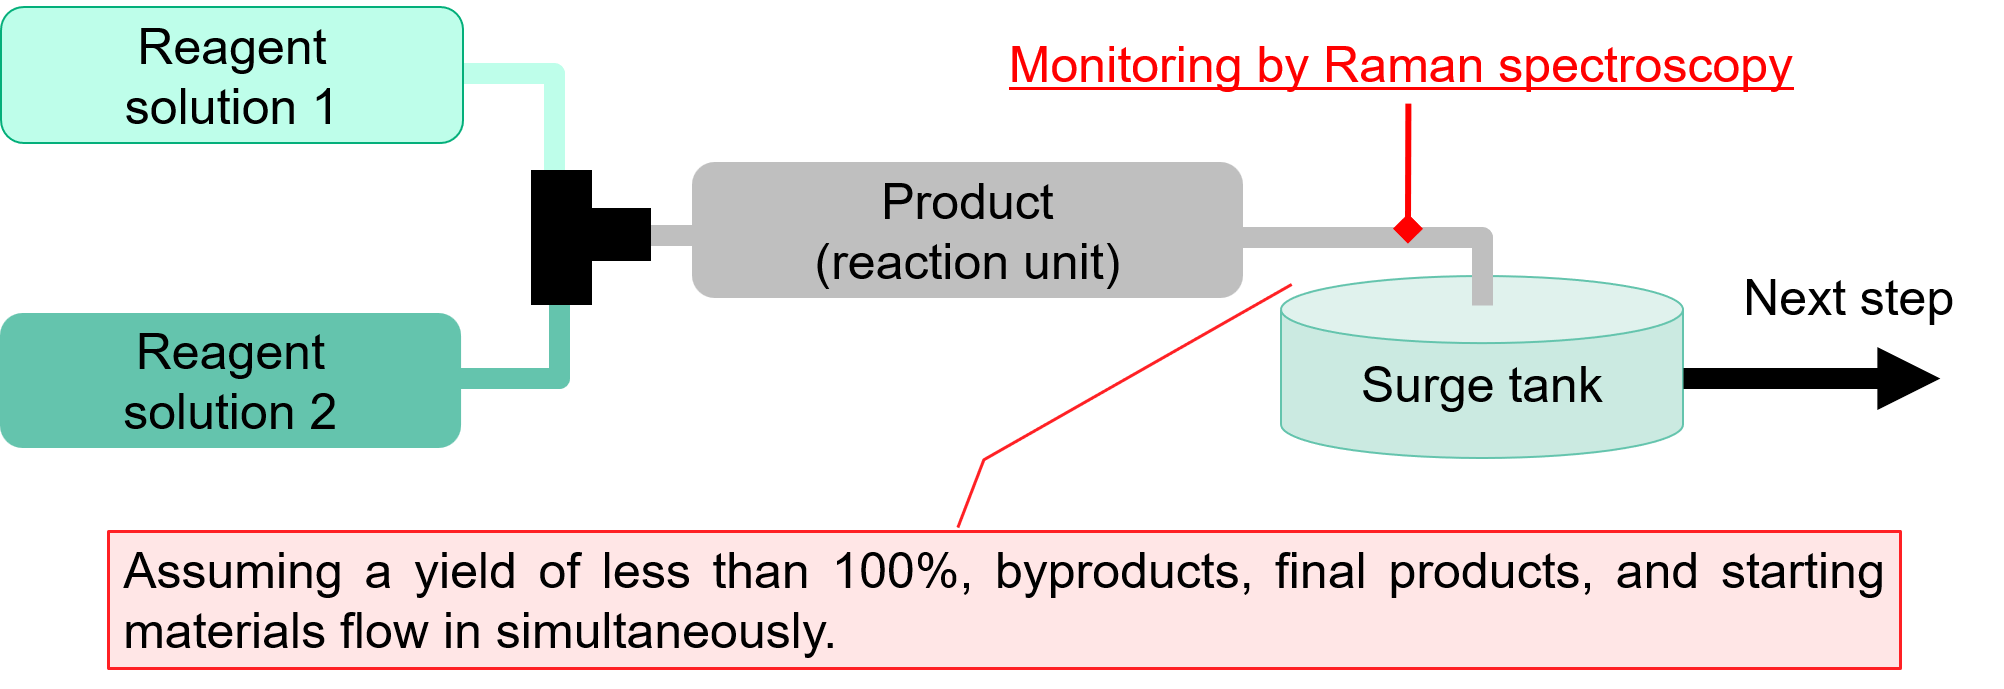
Figure 1 Schematic diagram of the flow synthesis system
Experimental
To detect compositional changes, a sample was intentionally introduced into a constantly flowing solvent to create temporal variations.
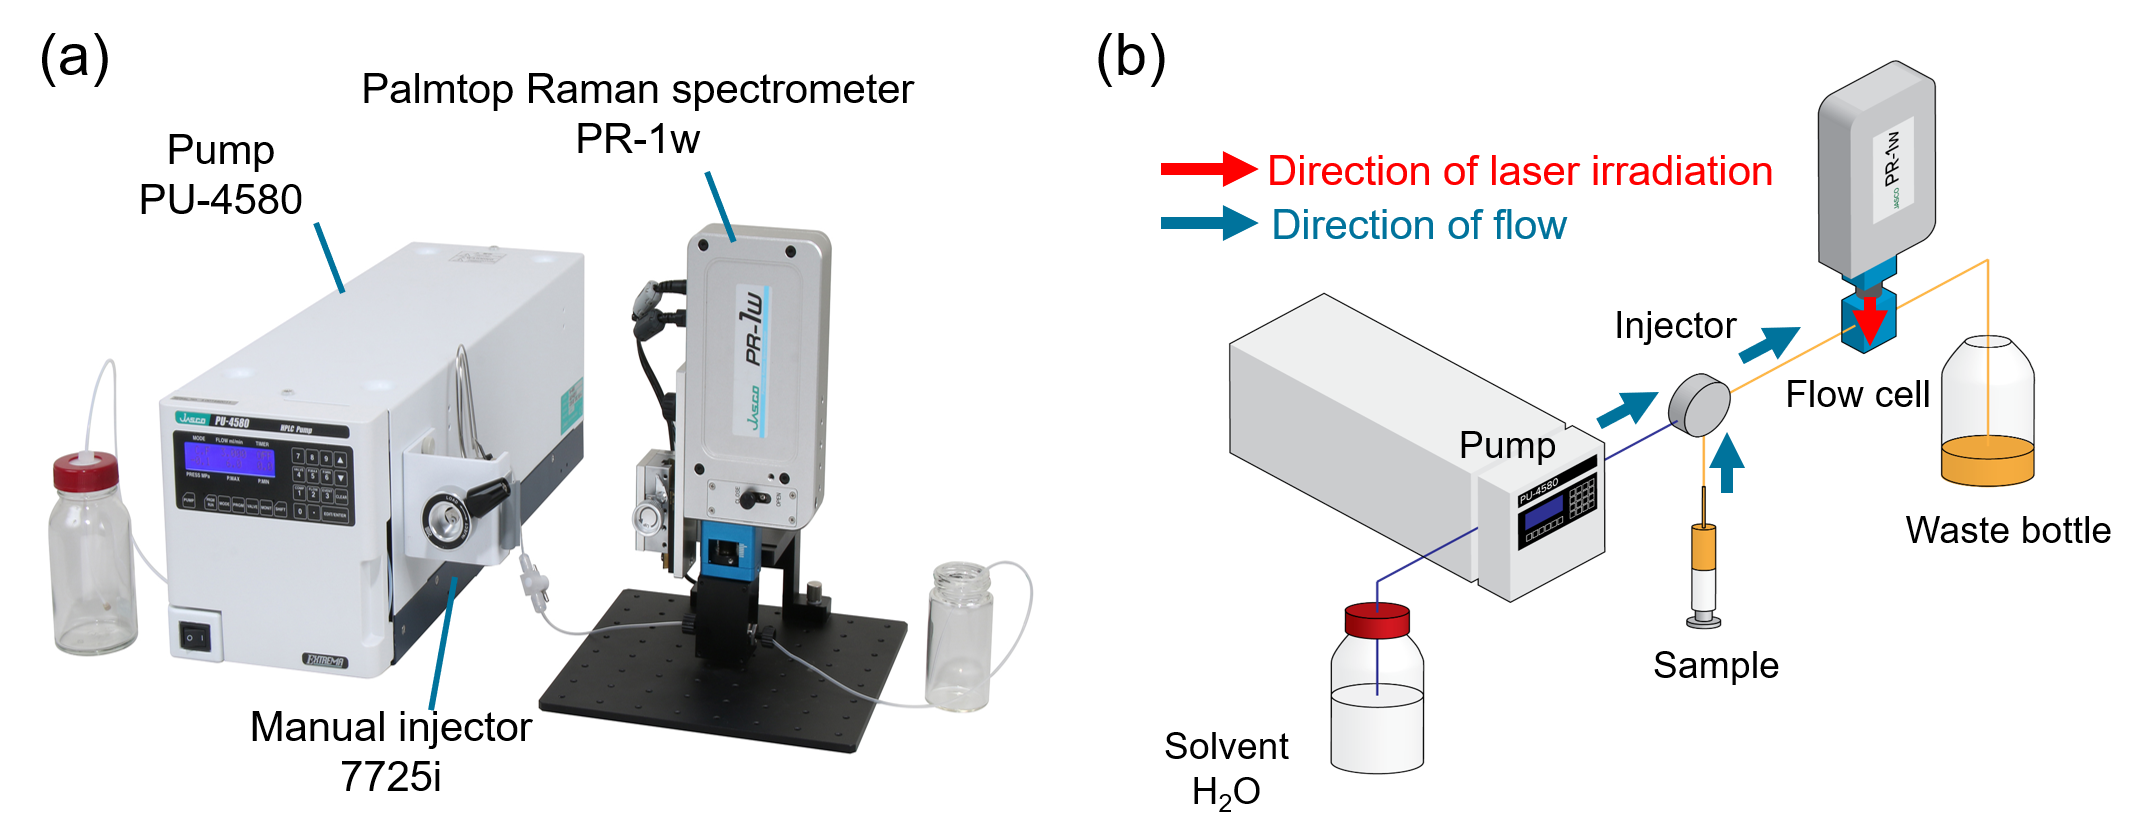
Figure 2 (a) Monitoring system (b) Flow system diagram
Measurement conditions
Excitation wavelength: 785 nm
Laser power: 50 mW
Exposure time: 4 sec
Number of accumulations: 1
Measurement interval: 5 sec
Solvent: H2O
Advantages of this system
Compact design: Enables easy integration into a variety of measurement systems.
Flexible monitoring: Monitors various phases of the synthesis process by simply connecting a flow cell.
Results
Flow Monitoring System Reproducibility
Reproducibility was evaluated by injecting 20 µL of a 1.12 M alanine (Ala) solution at flow rates of 0.5 mL/min (repeated) and 1.0 mL/min.
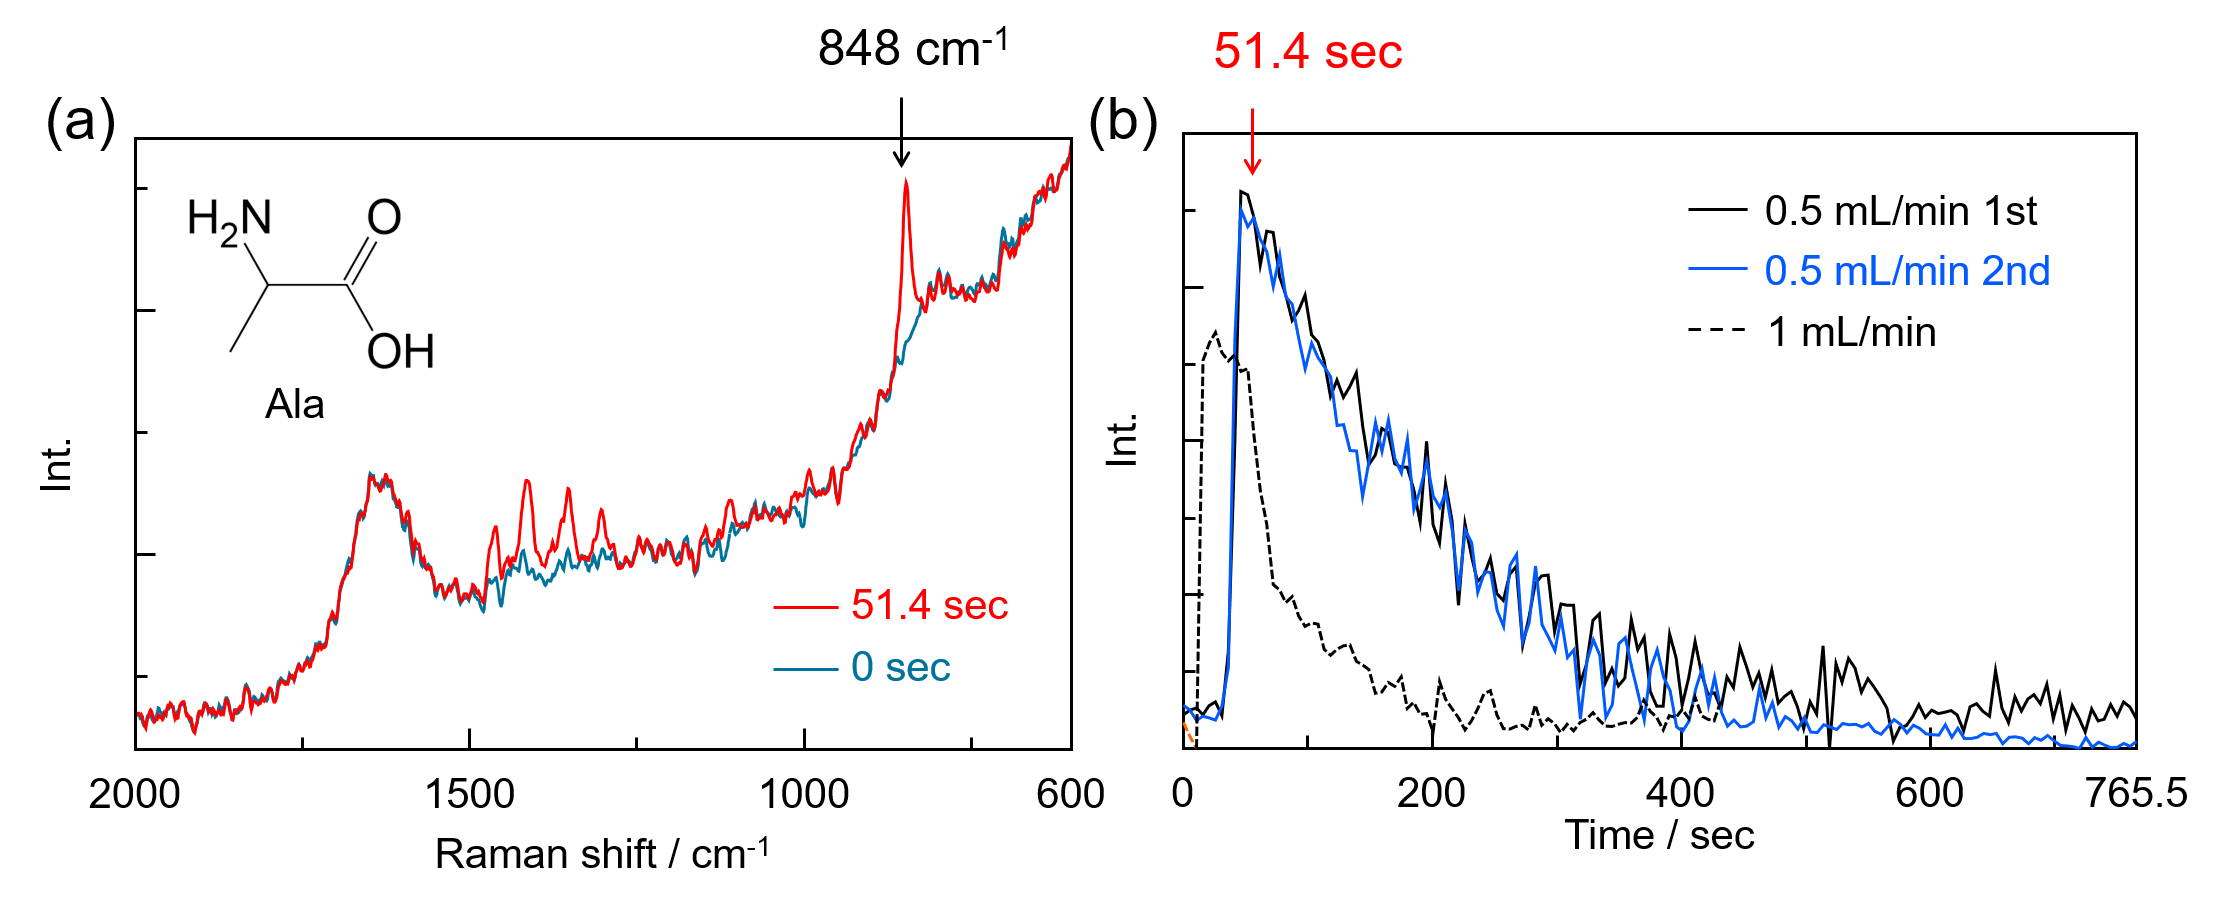
Figure 3 (a) Raman spectra at 0 sec and 51.4 sec (b) Temporal change in Ala peak intensity at 848 cm-1
This system can accurately detect the presence of specific compounds as they flow into the cell.
Real-Time Monitoring of Two-Component Solution
In a flow synthesis process, reactants and products flow in a mixed state. We used glycine (Gly) as the starting material and glycylglycine (Gly-Gly) as the product to prepare solutions with various mixing ratios for measurement.
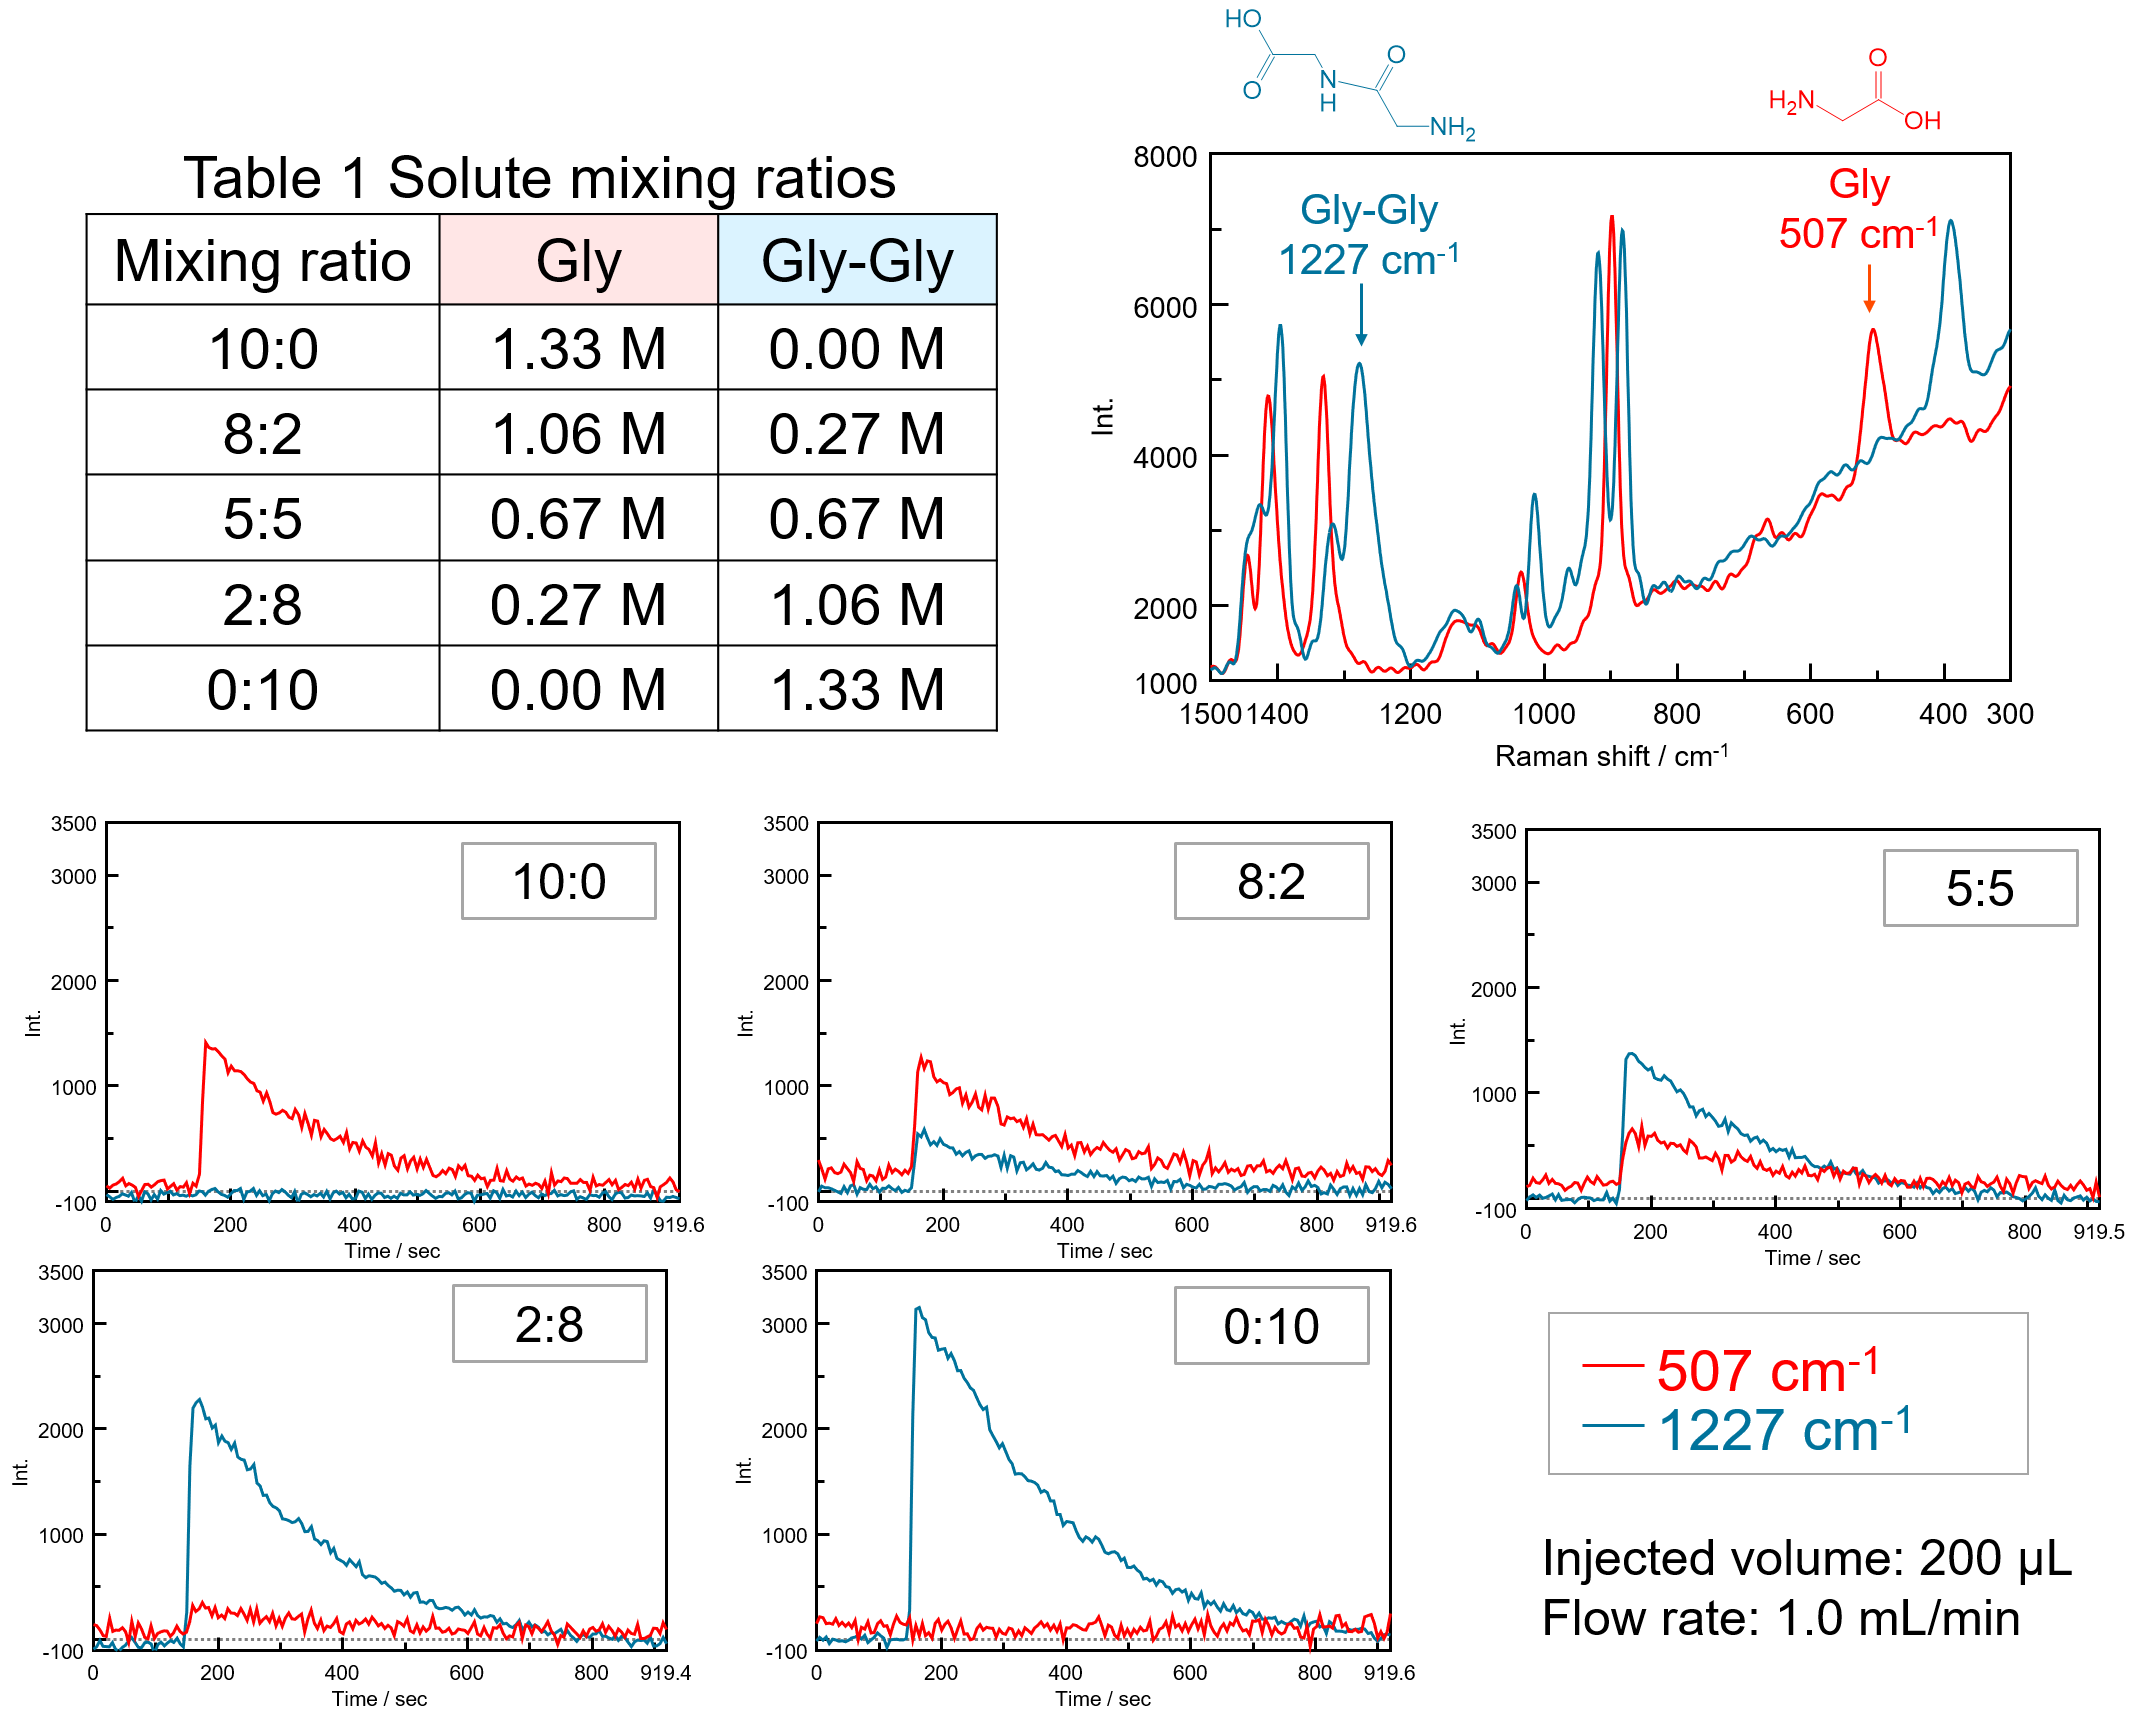
Figure 4 Temporal change in intensity at 507 cm-1 (Gly) and 1227 cm-1 (Gly-Gly)
Using the individual bands associated with Gly and Gly-Gly, real-time concentration changes of each component in the mixed solution were simultaneously detected.
Quantitative Evaluation
To assess the system’s quantitative performance, we created a calibration curve using the partial least-squares method. Mixed solutions with known concentrations (Table 1) were directly injected into the cell to avoid dilution by the mobile phase.
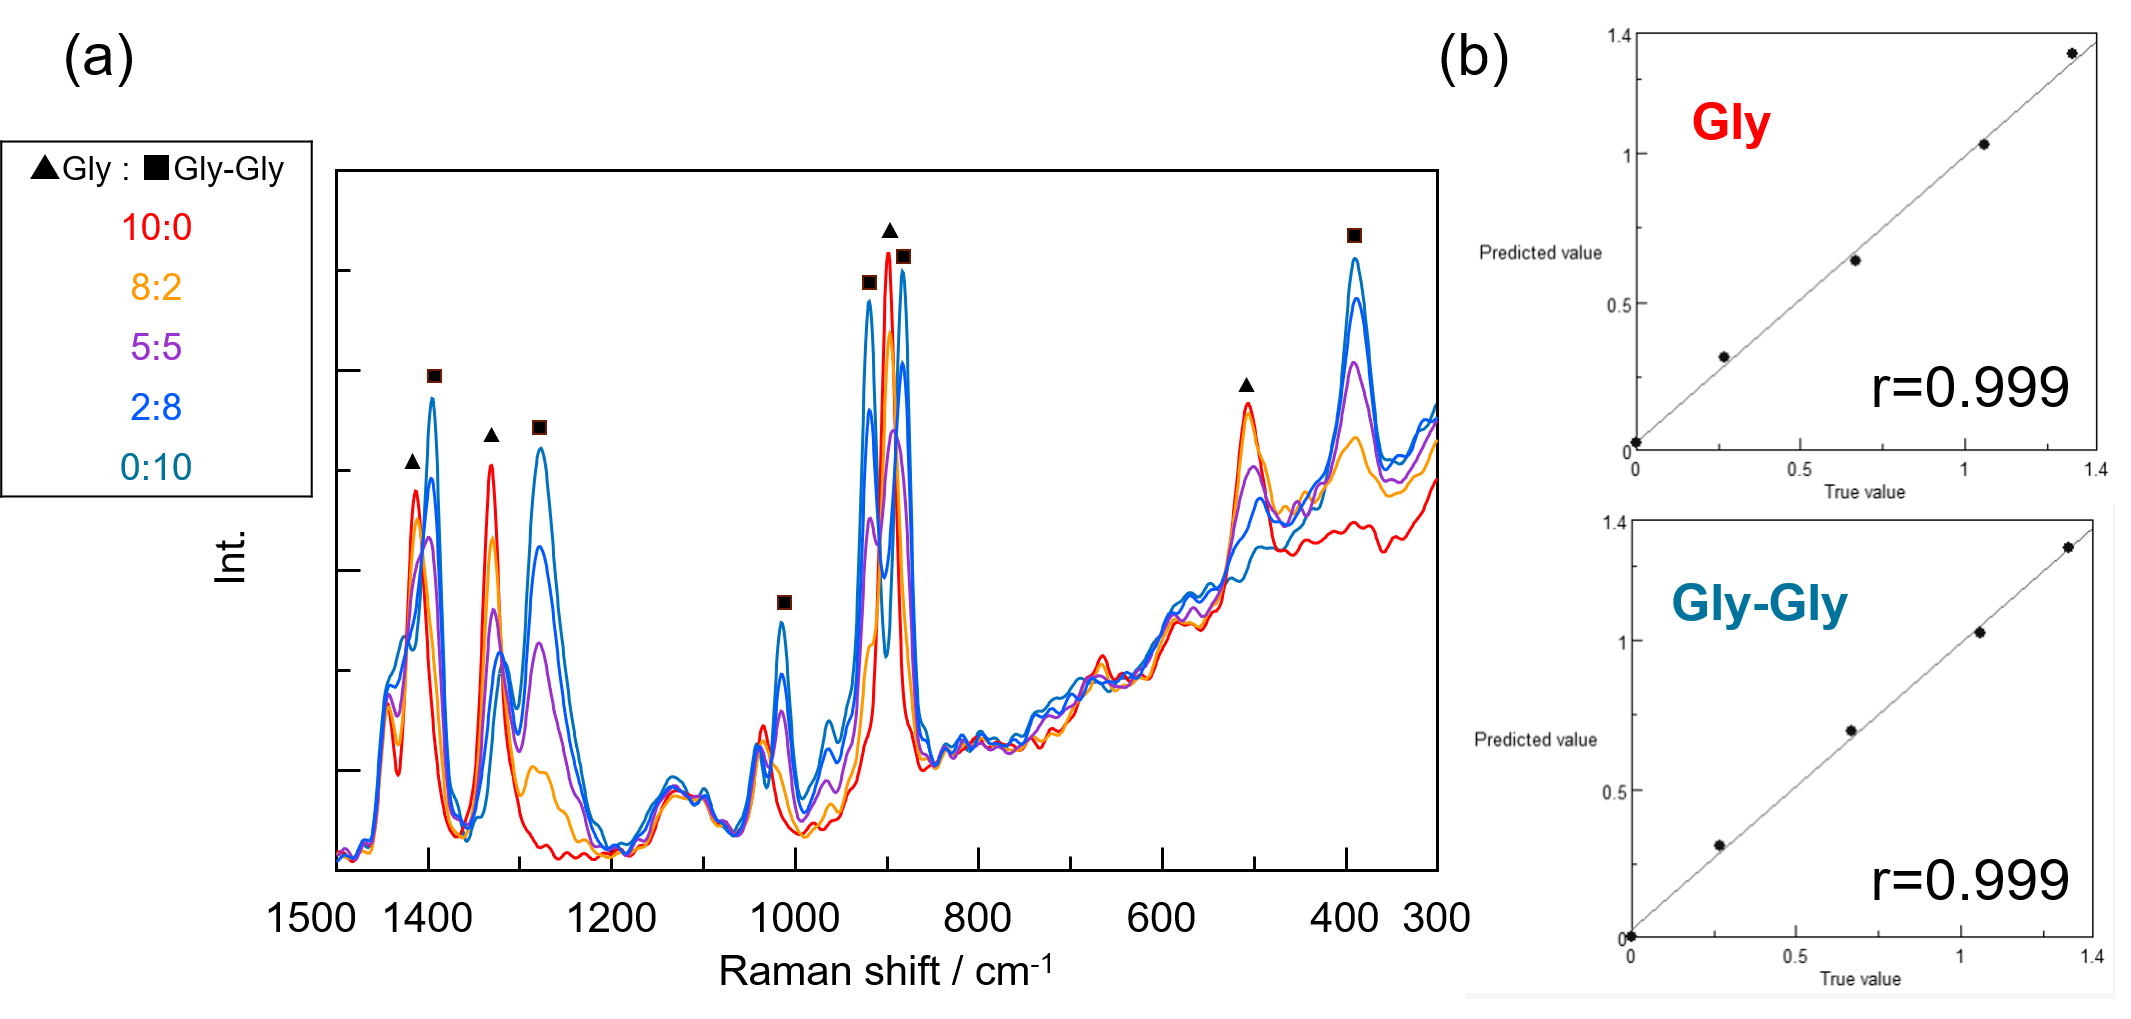
Figure 5 (a) Raman spectra (b) calibration curve
In the concentration range of 0.00 to 1.33 M, the high quantitative performance of this system was confirmed.
Conclusion
This study demonstrated the effectiveness of using a Raman spectrometer for real-time monitoring of a peptide flow-synthesis system.
Reproducibility & Detection: We confirmed high reproducibility in component detection and the ability to simultaneously track real-time concentration changes in mixed solutions.
Quantitative Performance: The system showed strong quantitative capabilities, with a calibration curve correlation coefficient (r) of over 0.999.
Our next step is to apply this system to actual peptide synthesis processes to verify its practical utility.
References
[1] S. Mine, et al., “Development of a monitoring system using Raman spectroscopy for the flow synthesis process” Poster presented at: RSC-JAIMA Symposium on Analytical Chemistry 2024, September 2024, Chiba.
[2] G. Gerzon, Y. Sheng, M. Kirkitadze, J. Pharm. Biomed, 207, 114379 (2022).
Poster Session at RSC-JAIMA Symposium on Analytical Chemistry 2025 (September 4 – 5, 2025, in Makuhari Messe, JAPAN)
Sarina Mine, Haruka Ochiai, Kohei Tamura, Satoe Iijima, Satoko Suzuki, Kenichi Akao
JASCO Corporation
Related Posts:
 Reaction Monitoring System using Surface-Enhanced…
 Monitoring of Aggregates and Degradation Products by…
 Monitoring Microbial Fermentation using Raman Spectroscopy
 Monitoring of Degree of Crosslinking for Epoxy…
 Highly efficient assessment of higher-order…
 Assessment of Aggregates in Antibody Drugs by SEC