Introduction
Fluorescence anisotropy (r) is the ratio of the polarized component to total intensity. It depends on the fluorescence lifetime (the time from exciting the phosphor to emitting the light), and depends on what degree its fluorescent does not move during the fluorescence lifetime and maintains the polarization when it is excited. Therefore, measuring its parameter (or fluorescence polarization) enables to know the degree of fluorescent’s rotation, which depends on the molecular size, the viscosity around the molecule, the intermolecular interaction and so on. These techniques mainly apply to the following measurements of bio-sample.
• Size/conformation monitoring of biopolymer
• Evaluation of local structure in biopolymer
• Evaluation of inter-biomolecule interaction
This article will demonstrate the use of the spectrofluorometer and its automatic polarizers to monitor the temperature-dependent polarization of diphenyl hexatriene (DPH) upon addition to a lipid bilayer.
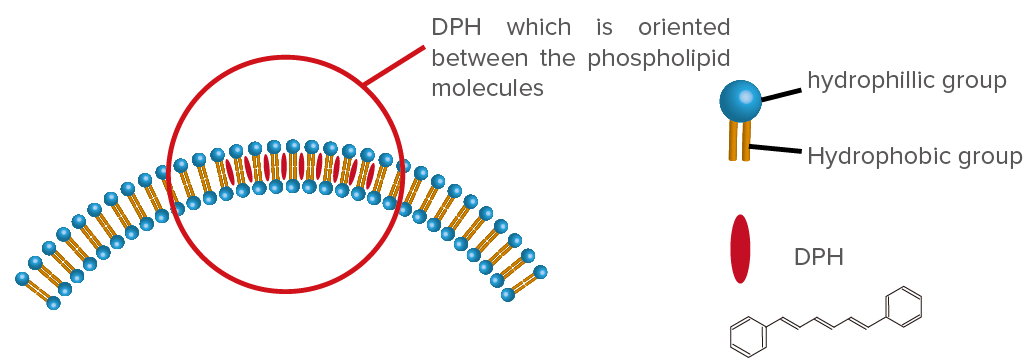
DPH which is oriented between the phospholipid molecules has strong polarization property, and the status of biomembrane can be monitored by depolarization measurement.
Experimental
Measurement procedure
(1) Calculation of G factor
Since the monochromator in emission side has polarization characteristics, G factor (G) for correcting the instrumental polarization artifacts should be calculated beforehand by using fluorescent dye for fluorescence depolarization measurement. The polarizer at excitation side should be installed to horizontal orientation (H), and then the intensity when the analyzer at emission side is set to vertical orientation (V) should be measured (IHV), and the one when the analyzer is set to horizontal orientation (H) should be measured (IHH). G factor is calculated as below.
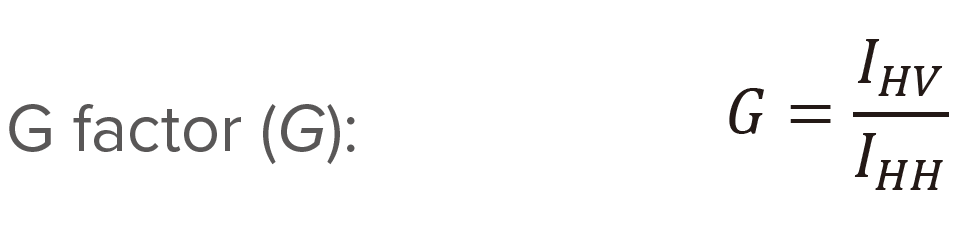
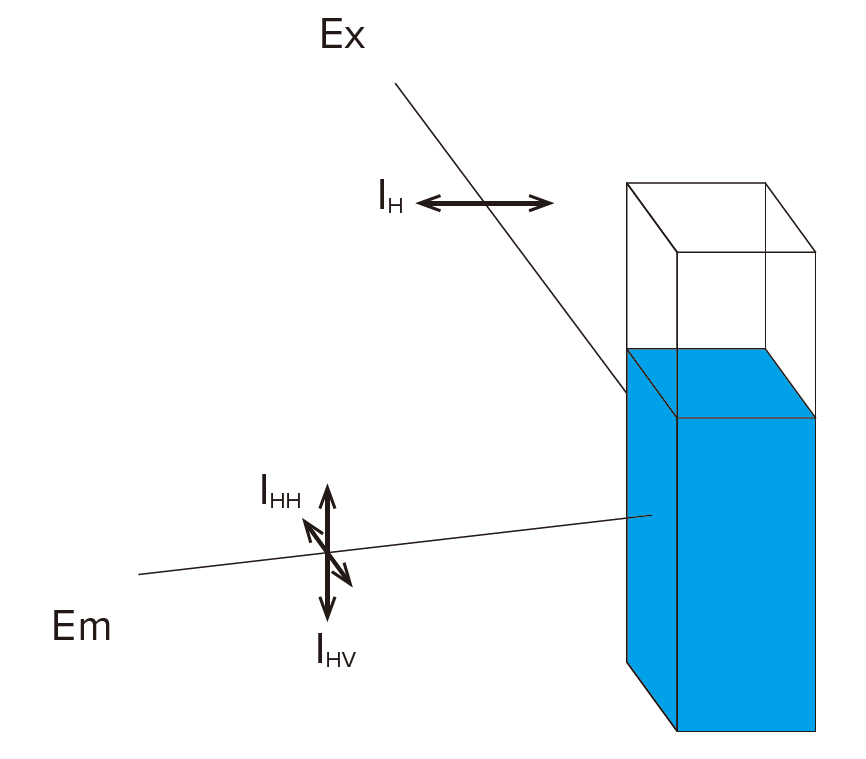
Figure 1. Measurement overview of G factor
(2) Calculation of fluorescence anisotropy and fluorescence polarization
The polarizer at excitation side should be installed to vertical orientation (V), and then the intensity when the analyzer at emission side is set to vertical orientation (V) should be measured (IVV), and the one when the analyzer is set to horizontal orientation (H) should be measured (IVH). G factor is applied to IVH to perform the instrumental correction.
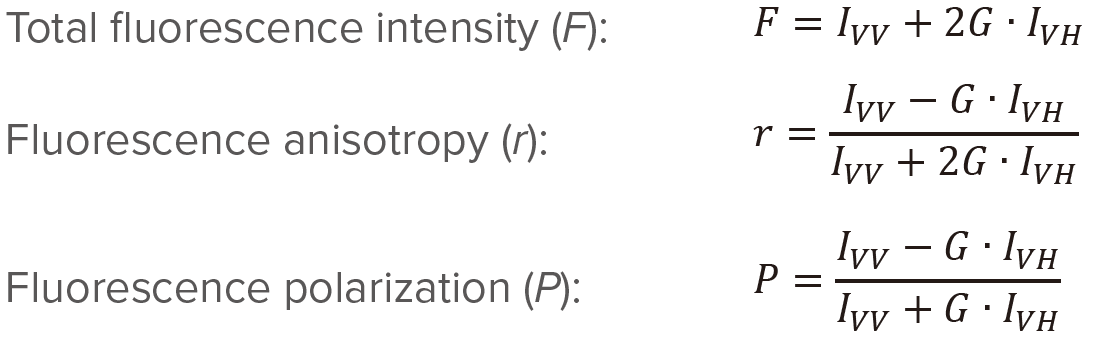
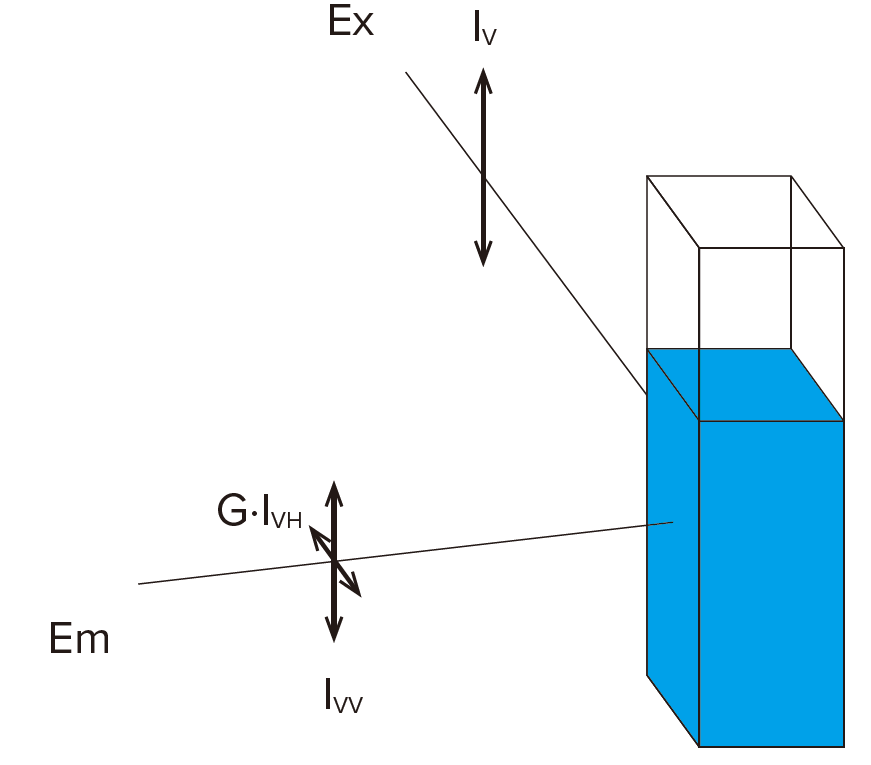
Figure 2. Measurement overview of fluorescence anisotropy and polarization
Samples
– Phospholipid: 130 μM
– DPH: 0.6 μM
Measurement parameters
Excitation wavelength: 357 nm
Emission wavelength: 430 nm
Bandwidth (excitation): 5 nm
Bandwidth (emission): 5 nm
Response: 2 sec.
Data interval: 0.1 ºC
Ramping rate: 20 ºC/hour
FP-8350 Spectrofluorometer
Results
G factor was measured by using mixture sample (liposome and DPH), and then temperature scan measurement was performed. DPH is located to the space between the lipid bilayers, and is oriented in a certain direction. Figure below shows the fluorescence anisotropy at each temperature, and indicates that the motion of DPH is confined at low temperature. In addition, it also shows that the depolarization occurs at approximately 40 ºC. It means that the fluctuation of layer became large due to phase transition of lipid bilayer, and the motion of DPH became large.
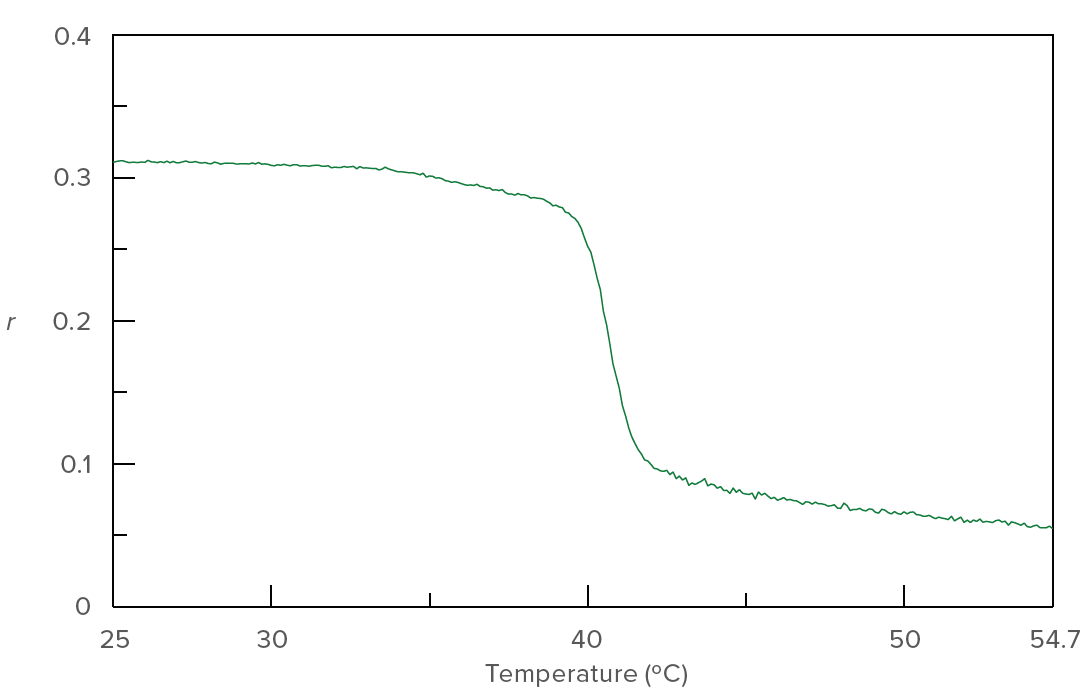
Figure 3. Fluorescence anisotropy at each temperature (DPH interacting with liposome)


