Introduction
Antibody drugs that can target specific antigens have received increasing attention in recent years. However, such drugs can lose their activity due to structural changes that depend on formulation conditions such as the solvent, pH, temperature, and storage environment. Therefore, in order to ensure the quality of pharmaceuticals, it is essential to evaluate the stability of antibody drugs.
Circular dichroism spectrometer (CD) is useful for evaluating the structural stability of biological macromolecules, including antibodies, because it can easily determine the structure of proteins under homogeneous conditions.
Here, a high-throughput CD (HTCD) system was used to measure the CD spectrum of VHH antibodies under various pH and salt concentration conditions, and the results were analyzed numerically using the [Spectral QC Test] program. And we present an example of visualizing the change in the CD spectrum of VHH antibodies under various solvent conditions. In addition, we performed thermal denaturation measurements and determined the relationship between the spectral change and the denaturation temperature for each condition.
VHH antibodies
VHH antibodies are variable domains of heavy chain antibodies composed only of H chains, and are known to be possessed by camelids. They have the following characteristics:
- A long CDR3 region with a high binding capacity
- Easy expression due to being a low molecular weight 15 KDa antibody
- High stability against pH and temperature
- Easy antibody modification
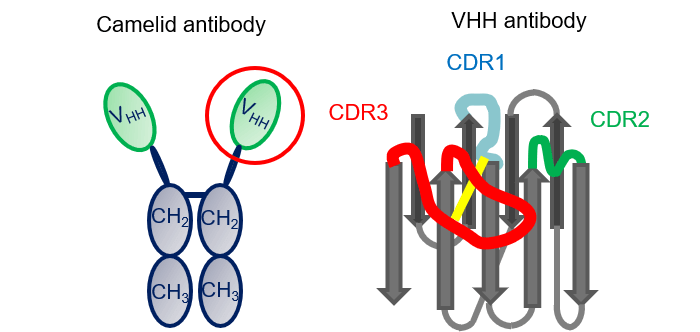
Fig.1 Schematic diagram of VHH antibody
Measurement System
<Screening measurement>
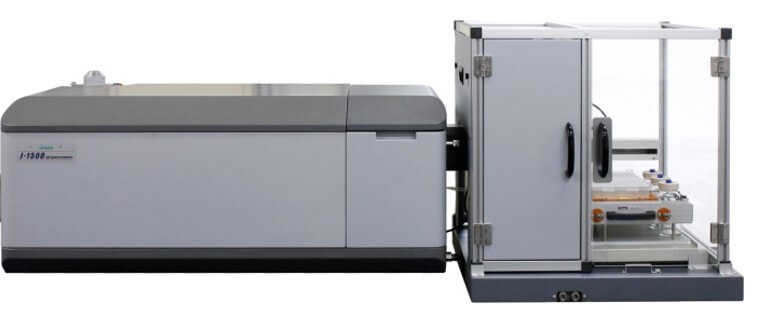
Figure 2. HTCD system (J-1500 + HTCD Plus)
Features
– Fully automated sample suction, and flushing and drying of the flow path
– Up to 192 samples can be measured
– All-night operation and for high work efficiency
<Thermal denaturation measurement>
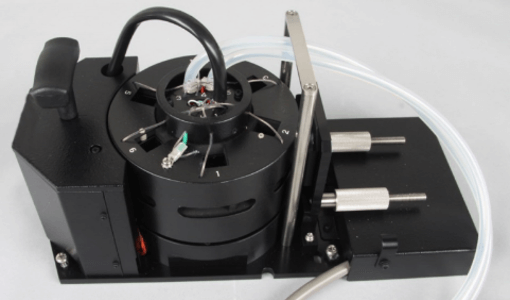
Figure 3. MPTC-513 Automatic 6-Position Peltier Thermostatted Turret Cell Changer
Features
– 6 samples can be measured
– Accurate temperature monitoring with in-cell sensors
Experimental
Measurement and analysis
<Screening measurement>
- Using the HTCD system, 10 samples of VHH antibodies were measured as a reference under conditions of pH 7 and NaCl concentration of 200 mM, and other samples with different solvent conditions were measured a single time.
- Using the calculated mean (μ), standard deviation (σ) and correlation coefficient (χ) between the average reference spectrum and the sample spectrum, the Z-score for the reference spectrum was determined using:

<Thermal denaturation measurement>
Denaturation of VHH antibodies was investigated for different solvent conditions, and the denaturation temperature (Tm) was calculated.
Samples
- VHH concentration: 0.5 mg/mL
- Buffer: 50 mM citric acid (pH 3, 4, 5, 6), 50 mM phosphoric acid (pH 7, 8), 50 mM CHAPS (pH 9, 10, 11)
- NaCl concentration: 10, 100, 200, 400, 600, 800, 1000 mM
Measurement parameters
<Screening measurement>
Data interval: 0.1 nm
D.I.T.: 2 sec.
Bandwidth: 1 nm
Scan speed: 100 nm/min
Cell pathlength: 0.2 mm
Accumulations: 4
<Thermal denaturation measurement>
Wavelength: 236 nm
Data interval: 1 °C
D.I.T.: 2 sec.
Bandwidth: 1 nm
Temperature rate: 1 °C/min
Cell pathlength: 1 mm
Keywords
Circular dichroism analysis, High-throughput CD system, HTCD, VHH antibody, Antibody drug
Results
1. Screening measurement
Fig.4 shows the results of screening measurements at an NaCl concentration of 200 mM. In the pH 3 and pH 4 CD spectra, the negative peak at 217 nm caused by β-sheets, and that at 227 nm, which is considered to be due to β-sheet interactions, are changed compared to those in the pH 7 CD spectrum. By quantifying and visualizing this change in the spectrum using the Z-score, it is possible to evaluate it more objectively.
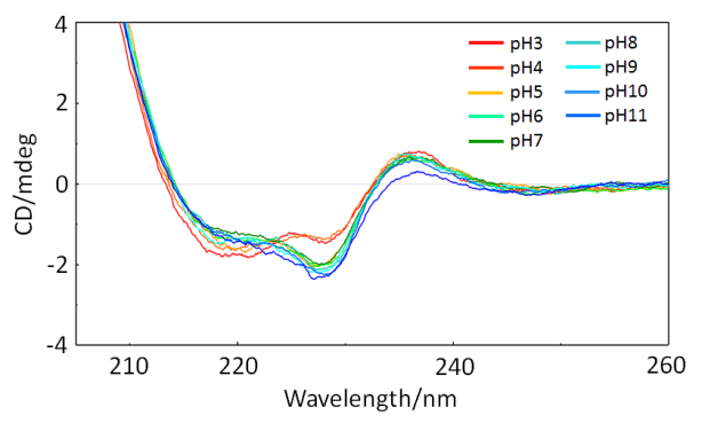
Fig.4. CD spectra of VHH antibodies for different pH conditions
The Z-score is small in the pH range from 6 to 9, and the structure is not significantly different to that for the reference sample at pH 7 and an NaCl concentration of 200 mM. On the other hand, at pH 5 and lower, or pH10 and higher, the Z score is large, indicating that the structure has changed. It can also be seen that the structure changes as the NaCl concentration increases.
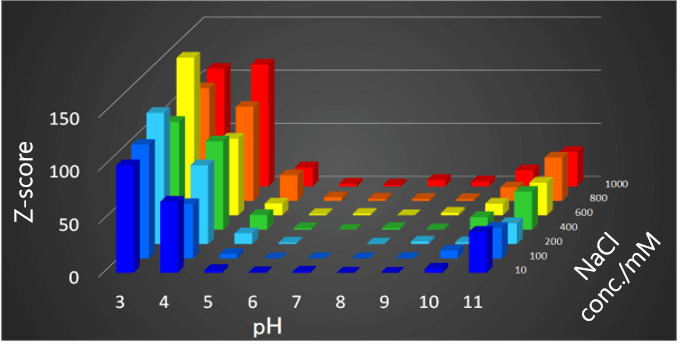
Fig.5 Relationship among pH and NaCl concentration of VHH antibodies and Z score
2. Thermal denaturation measurement
Fig.6 shows the relationship between the Z-score obtained from the screening measurements and the denaturation temperature obtained from the thermal denaturation measurements.
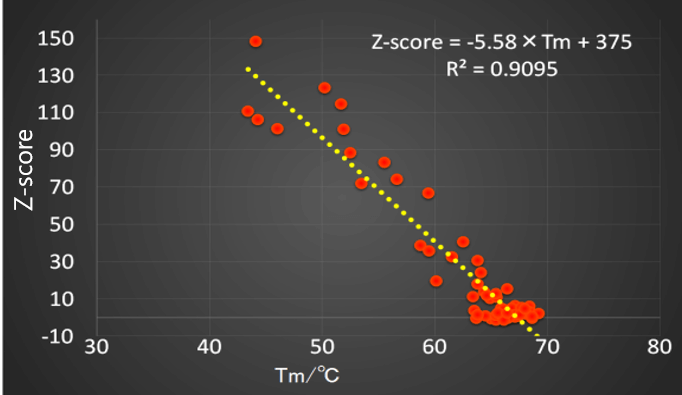
Fig.6 Relation between denaturation temperature of VHH antibodies and Z-score
In this way, using a HTCD system that can automatically measure the CD spectrum of a sample under various conditions, and the [Spectral QC Test] program that can quantify the amount of change in the spectrum, differences between spectra can be visualized and quantified.
Conclusion
In experiments on the denaturation of VHH antibodies under various conditions studied using this system, a high correlation was obtained between the Z score and the denaturation temperature. This suggests that the Z-score method for evaluating antibody drug stability is effective for primary screening before conducting a time-consuming thermal stability evaluation.
References
* This application was developed under the guidance of Professor Kohei Tsumoto of the University of Tokyo.


