Introduction
The discovery of modified nucleic acids that reduce the immunogenicity of messenger RNA (mRNA) and the establishment of lipid nanoparticle (LNP)-based drug delivery technology have led to widespread research on mRNA pharmaceutical applications1). In particular, since mRNA vaccines play a major role in the termination of new coronavirus infection (COVID-19), research and development of mRNA medicine has attracted much attention. mRNA medicines have the potential to treat various unmet medical needs or operate as vaccines, since they can be developed rapidly. As of May 2023, more than 100 mRNA products have reached the clinical trial stage2,3). Since low thermal stability is one of the challenges in transportation and storage of mRNA medicines, clarification of the higher-order structure, stability, and physicochemical properties of mRNA in LNP formulation will lead to the development of robust mRNA medicines4).
Circular dichroism (CD) spectroscopy is widely known as a method for rapidly evaluating the higher-order structure of biological macromolecules such as proteins and nucleic acids at low concentration5,6). Structural changes in proteins and nucleic acids caused by perturbations such as heat, pH, additives, and chemical denaturants can be tracked by CD spectroscopy making it an effective tool in the research and development of pharmaceuticals.
Here, we introduce an application that evaluates the thermal stability of mRNA particles formed using LNP by taking advantage of the features of CD spectroscopy.
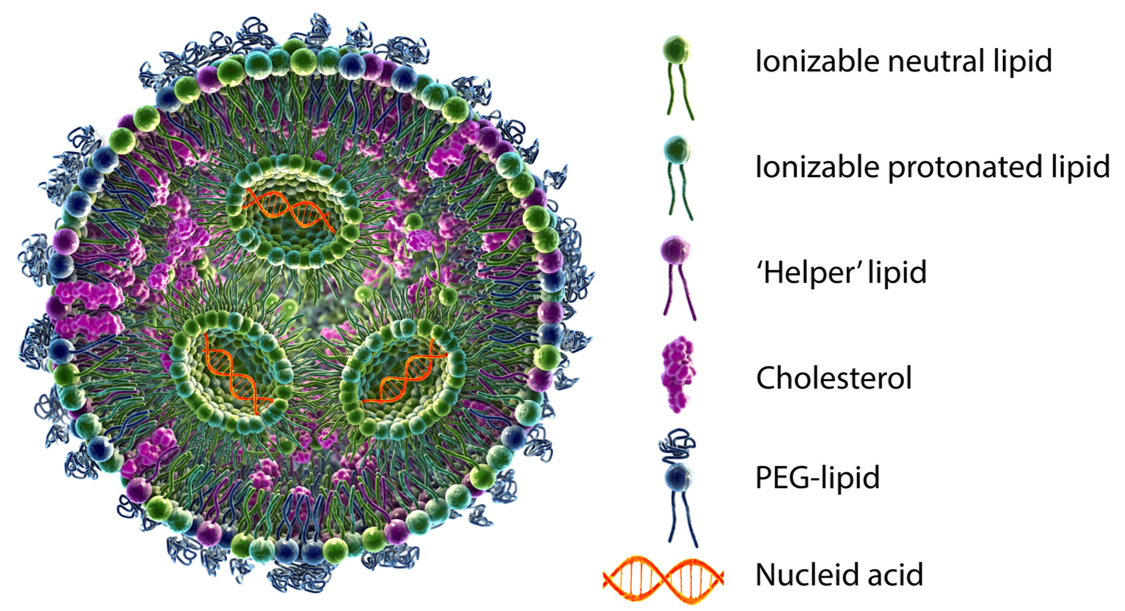
Fig. 1 schematic diagram of mRNA–LNP
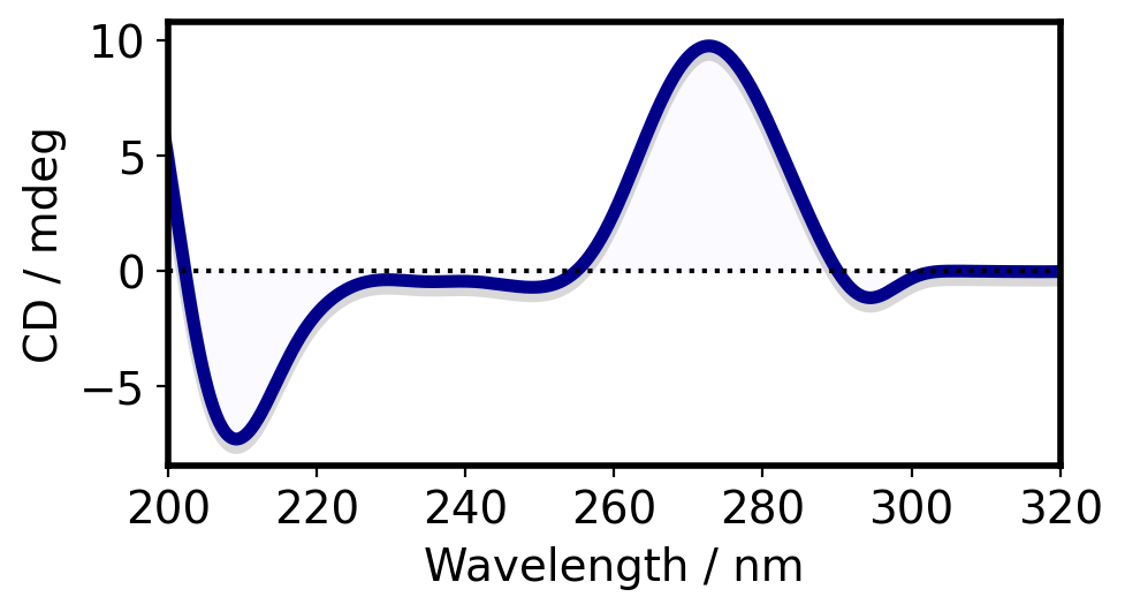
Fig.2 A-form RNA. CD spectrum
Experimental
Sample
0.1 mg/mL mRNA: mRNA
0.1 mg/mL mRNA encapsulated in LNP : mRNA/LNP
0.1 mg/mL empty LNP: LNP
*All samples were dissolved in 1xPBS and measured using 1 mm CD quartz cells.
System
Instrument: J-1500 circular dichroism spectrometer
Attachments: PTC-510, CTU-100
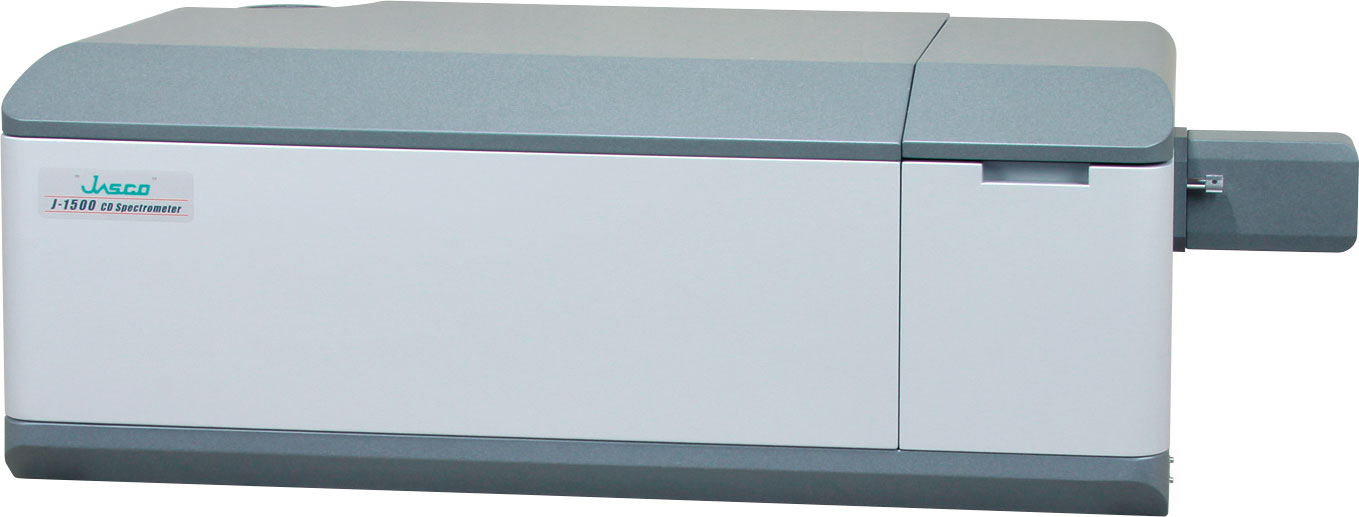
Fig.3 Measurement system
Measurement condition
Wavelength range: 205 nm-320 nm
Scan speed: 50 nm/min
Response: 4 sec
Band width: 1.0 nm
Data interval: 0.1 nm
Scan: 4
Optical path length: 1 mm
Temperature range: 25 ºC – 95 ºC (2 ºC step)
Heating rate: 1 ºC /min
Keywords
mRNA-based therapeutics, Vaccine, LNP, Nucleic acid, Circular dichroism spectroscopy, CD, Thermal stability
Results
CD spectra of mRNA, LNP and mRNA/LNP
The CD spectra and standard deviation area of each sample at room temperature are shown in Fig. 4. The standard deviation of the spectra was calculated using 3 replicates for each sample. The CD spectrum of mRNA shows a negative peak at 210 nm and a positive peak at 265 nm, indicating the abundance of typical A-type double helix structure. The CD spectrum of LNP showed a negative peak at 207 nm, but other wavelengths did not show peaks that interfere with the mRNA CD spectrum7). The mRNA/LNP was found to contain abundant type A double helix structures.
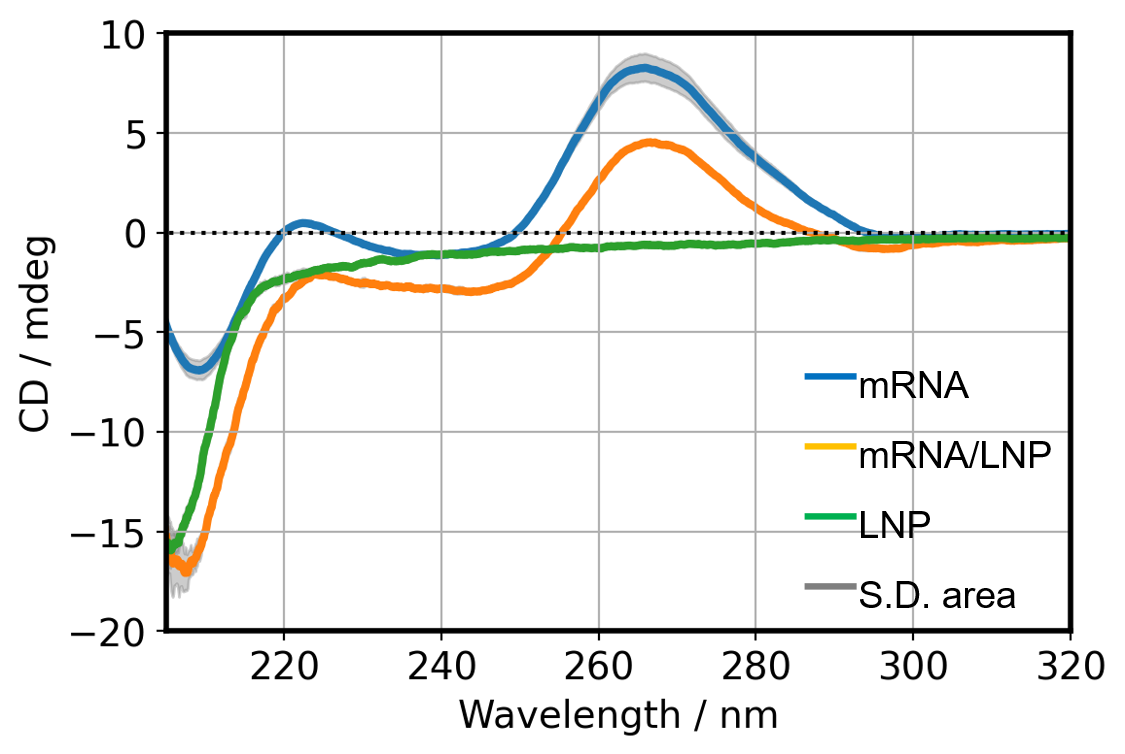
Fig. 4 CD spectra of each sample
Conformational change of mRNA by encapsulated in LNP
To confirm whether the structure of mRNA is changed by encapsulation, we compared the CD spectra of mRNA/LNP (encapsulated) and mRNA mixed with equimolar LNP (Fig. 5). The two CD spectra in Fig. 5 would match if there is no change in the structure of mRNA and LNPs due to mRNA encapsulated. However, a differences greater than the standard deviation is observed in these CD spectra near 210 nm and 265 nm region indicative of structural changing of mRNA and LNPs due to encapsulation.
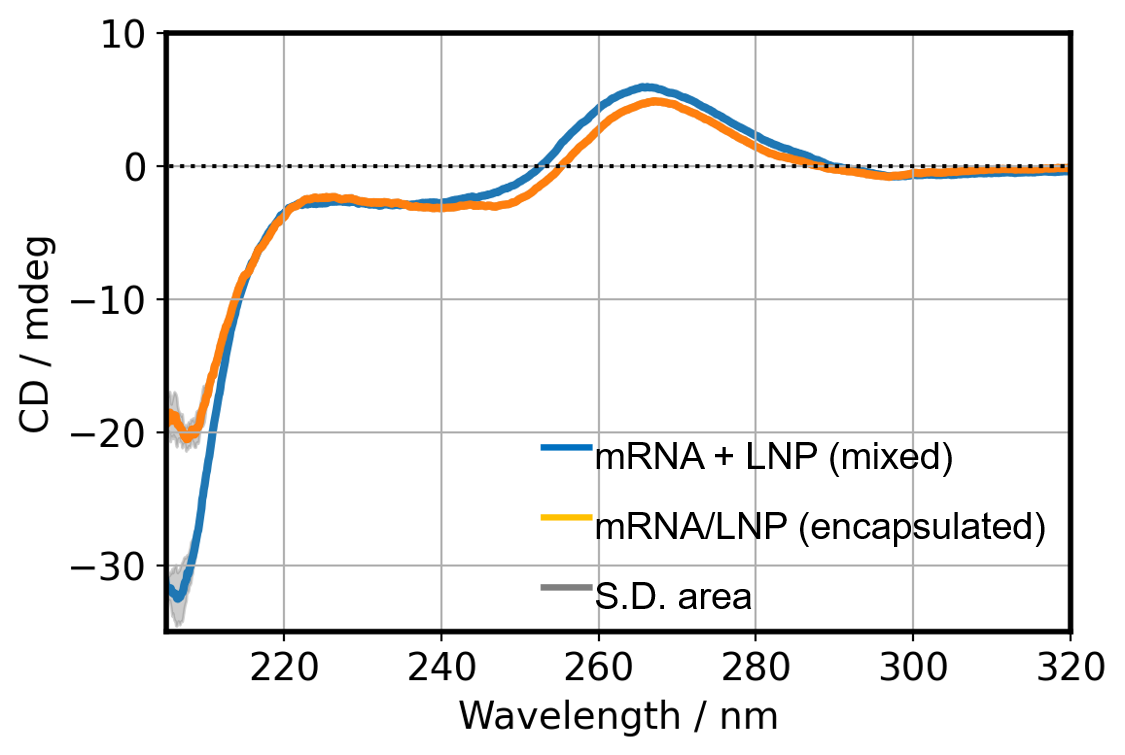
Fig. 5 CD spectra of mixed and encapsulated mRNA
Heat-induced conformational changes of mRNA, LNP and mRNA/LNP
For each sample, we measured the temperature-ramping CD spectra from 25-95 ºC. mRNA alone showed a loss of the peak intensity near 210 nm upon heating. The positive peak at 265 nm shifted to 270 nm while decreasing in intensity (Fig. 6a). This indicates that base pairing and stacking collapse upon heating and the presence of a single-stranded mRNA coil dominates. In LNP, the peak near 207 nm disappeared with heating (Fig. 6b). This may indicate that the cholesterol orientation in LNP is lost as LNP collapse. Similar to the changes observed for mRNA alone, changes in the CD spectra of the mRNA/LNP were also observed upon heating, which were thought to be due to the decay of mRNA base pairs and LNPs (Fig. 6c).
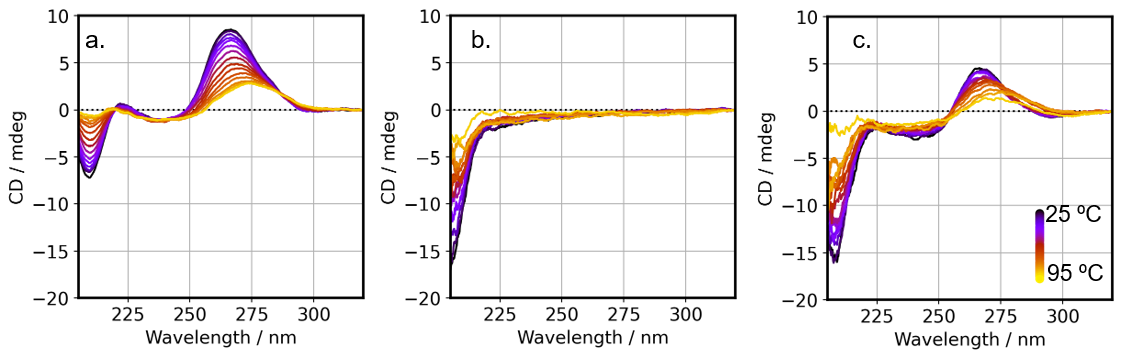
Fig. 6 Temperature-ramping CD spectra of each sample
a) mRNA b) LNP c) mRNA/LNP
Each CD spectrum is offset so that the CD value at 320 nm is zero.
Comparison of thermal stability between mRNA and mRNA/LNP
To confirm whether the thermal stability of mRNA is altered by encapsulation with LNPs, we evaluated the peak shift around 250-290 nm in the temperature-ramping CD spectra of mRNA and mRNA/LNP. As mentioned above, a shift of the peak position to longer wavelengths indicates base pair dissociation and denaturation of the higher-order structure of mRNA. The peak shift was calculated from the barycentric mean of the spectrum (Eq. 1), and the relative ratio of denatured mRNA was calculated by normalizing the data between the 25 ºC and 95 ºC peak positions (Fig. 7), assuming complete higher-order structure formation at 25 ºC and complete higher-order structure denaturation at 95 ºC. By fitting both data using the Hill equation (Eq. 2), the denaturation midpoint (Tm), a measure of thermal stability, and the Hill coefficient, a measure of cooperative collapse of higher-order structures, were obtained.

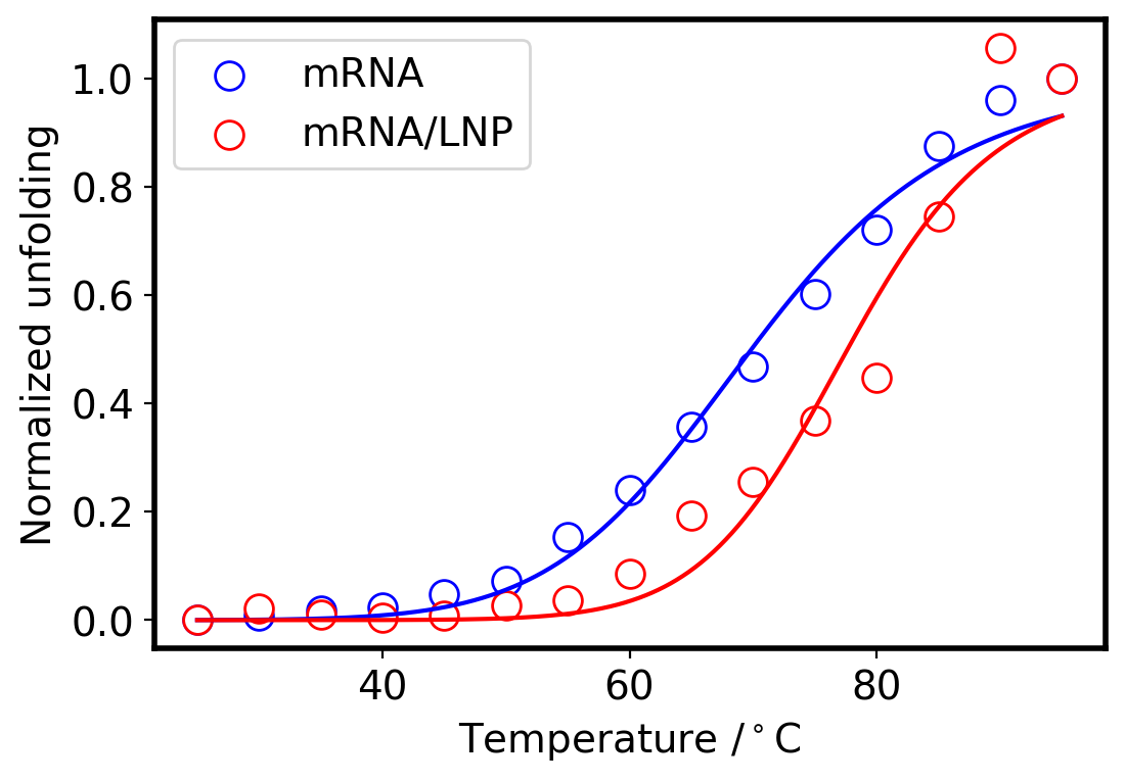
Fig. 7 Melting curve of mRNA and mRNA/LNP
The results showed that encapsulation mRNA exhibited higher Tm and Hill coefficient than mRNA alone, indicating that the higher-order structure of mRNA is stabilized by encapsulation. This trend is consistent with the report by Brader et al.4).
Table 1 Calculated parameter
| Tm / °C | Hill coef. | |
| mRNA | 69.9 | 8.4 |
| mRNA/LNP | 77.6 | 12.9 |
Conclusion
By using CD spectroscopy, we were able to evaluate mRNA structure, conformational change by encapsulation in LNP, and thermal stability. CD spectroscopy allows easy characterization of mRNA structure under various conditions such as pH, salt, and additives as well as heat.
References
1.V. Gote, PK. Bolla, N. Kommineni, A. Butreddy, PK. Nukala, SS. Palakurthi, W. Khan: Int J Mol Sci., 31, 2700 (2023). DOI: 10.3390/ijms24032700
2.M. Metkar, C.S. Pepin, M.J. Moore: Nat Rev Drug Discov, 23, 67 (2024). DOI: 10.1038/s41573-023-00827-x
3.T. Yoshida, T. Yamashita, T. Yamamoto, N. Ohoka, K. Itaka, H. Akita, F. Takeshita, J. Mineo, S. Tsujihata, T. Yamaguchi, E. Uchida, T. Inoue,: PMDRS, 54, 4, 3222 (2023).
4.M. Kloczewiak, JM. Banks, L. Jin, ML. Brader: Mol Pharm., 4, 2022 (2022). DOI:10.1021/acs.molpharmaceut.2c00092
5.A. Micsonai, É. Bulyáki, J. Kardos: Methods in molecular biology (Clifton, N.J.), 2199, 175–189 (2021).
6.J. Kypr, I. Kejnovská, D. Renciuk, M. Vorlícková: Nucleic Acids Res., 37, 1713 (2009). DOI: 10.1093/nar/gkp026.
7.J. Anindita, H. Tanaka, T. Yamakawa, Y. Sato, C. Matsumoto, K. Ishizaki, T. Oyama, S. Suzuki, K. Ueda, K. Higashi, K. Moribe, K. Sasaki, Y. Ogura, E. Yonemochi, Y. Sakurai, H. Hatakeyama, H. Akita: Pharmaceutics, 26 (2024). DOI: 10.3390/pharmaceutics16020181.
Acknowledgement
This application has been developed with the help of Professor Hidetaka Akita, Associate Professor Hiroki Tanaka, and Dr. Yu Sakurai of the Department of Drug Delivery, Tohoku University, who provided us with samples.
 and Fluorescence Spectroscopy")


 Analysis of CBN-Binding DNA Aptamer using CD Spectroscopy")