Introduction
Fluorescence resonance energy transfer (FRET) is a mechanism governing the energy transfer between two neighboring molecules. A donor, initially in its excited state, may transfer energy to an acceptor molecule through non-radiative electron resonance.
FRET is monitored using a spectrofluorometer, which measures the fluorescence/quenching of an acceptor or excited donor. FRET efficiency depends on the following factors: the distance between the donor and acceptor, the spectral overlap between the donor and acceptor, and the alignment of their dipole moments.
The efficiency is inversely proportional to the sixth power of the distance between the donor and acceptor, making the technique extremely sensitive to small changes in distance. When the overlap area of the donor fluorescence spectrum and the acceptor absorption spectrum is larger, FRET efficiency is higher. The FRET efficiency is also at a maximum when the two dipole moments are parallel or anti-parallel to each other, and no energy transfer occurs when the dipole moments are perpendicular to one another. Typically when the distance between the donor and acceptor is between 1 and 10 nm, FRET occurs.
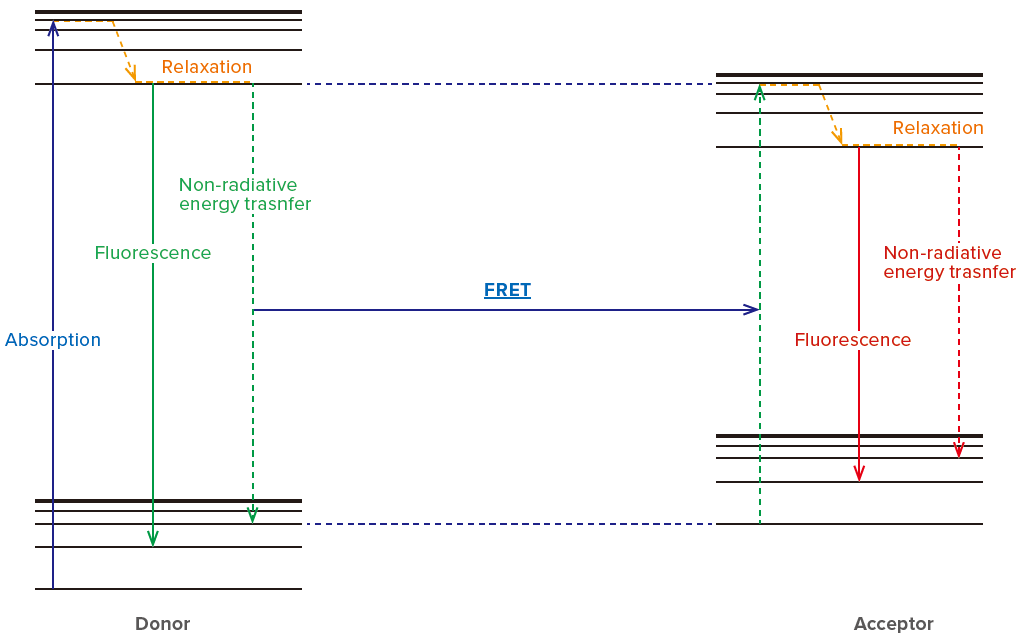
Figure 1. Jablonski diagram illustrating different transitions between a molecule’s energy states.
The efficiency is inversely proportional to the sixth power of the distance between the donor and acceptor, making the technique extremely sensitive to small changes in distance. When the overlap area of the donor fluorescence spectrum and the acceptor absorption spectrum is larger, FRET efficiency is higher. The FRET efficiency is also at a maximum when the two dipole moments are parallel or anti-parallel to each other, and no energy transfer occurs when the dipole moments are perpendicular to one another. Typically when the distance between the donor and acceptor is between 1 and 10 nm, FRET occurs.
An excellent example of a FRET application is the monitoring the complexing of murine anti-TNT monoclonal antibody (anti-TNT mAb) with aromatic nitrogen based explosives such as trinitrotoluene (TNT). Anti-TNT mAb absorbs excitation light of 280 nm, and produces fluorescence light of 340 nm. When anti-TNT mAb forms a complex with TNT, FRET occurs between the anti-TNT mAb (donor) and TNT (acceptor). The energy is transferred from the anti-TNT mAb excited at 280 nm to the TNT, and the fluorescence at 340 nm from the anti-TNT mAb is quenched (Figure 2). By utilizing this interaction as biosensor, this application note shows the evaluation of the sensitivity between the aromatic nitro compounds and anti-TNT mAb [2].
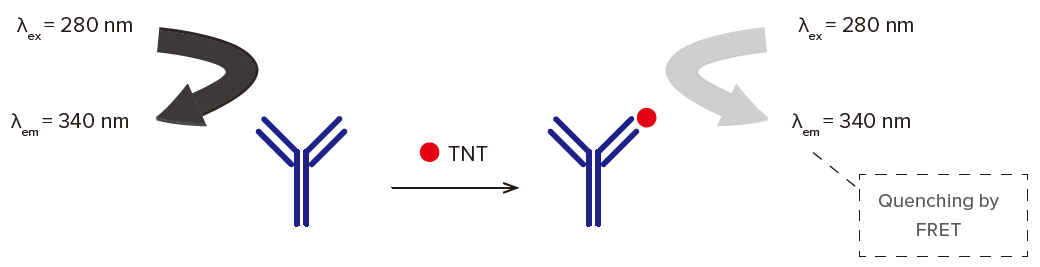
Figure 2. Schematic illustration of fluorescence quenching caused by TNT detection of anti-TNT.
Experimental
10 μL of 4.4 x 10⁻⁸ M TNT solution was added to 800 μL of 1.6 x 10⁻⁷ M anti-TNT mAb, and the fluorescence measurements were performed using the parameters below. After each measurement, the final concentration of TNT was increased step-by-step by adding each 10 μL of TNT solution (4.4 x 10⁻⁷ M, 4.4 x 10⁻⁶ M, 4.4 x 10-5.5 M and 4.4 x 10⁻⁵ M), and fluorescence measurement of each different TNT concentration solution was performed.
| Measurement Conditions | |||
| Excitation Wavelength | 280 nm | Emission Range | 300-500 nm |
| Excitation Bandwidth | 1 nm | Emission Bandwidth | 20 nm |
| Data Interval | 0.5 nm | Response | 1 sec |
| Sensitivity | 500 V | Spectral Correction | ON |
FP-8550 Spectrofluorometer
Keywords
FP-8500, Fluorescence, Fluorescence Resonance Energy Transfer, FRET, TNT, Immunosensors, Biochemistry, Materials
Results
The fluorescence spectra of a mixture solution of anti-TNT mAb and TNT are shown in Figure 3. As the TNT concentration increases, the fluorescence intensity of anti-TNT mAb becomes weaker. Similar measurements were performed using other aromatic nitro compounds as samples. The degree of progress of complex formation reaction was determined by the decrease in the fluorescence intensity at 340 nm.
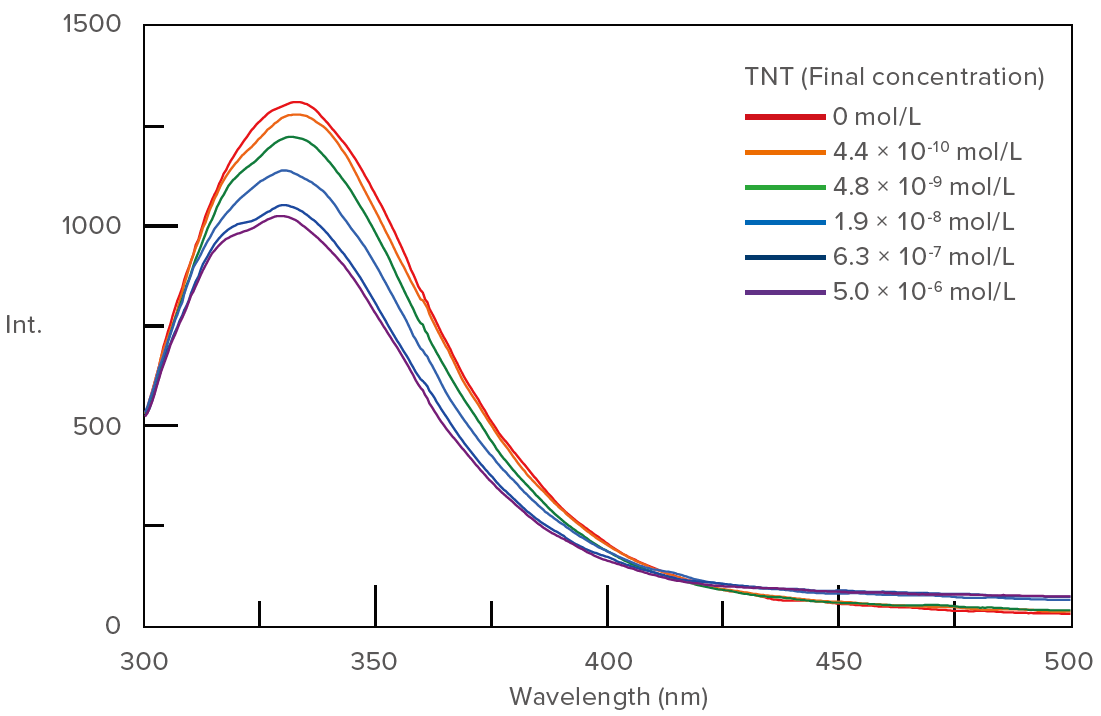
Figure 3. Fluorescence spectra of solutions containing anti-TNT mAb and various concentration of TNT.
Figure 4 shows the relationship between the dose of aromatic nitro compounds and the reaction ratio. From this curve, the half maximal inhibitory concentration (IC50) was estimated (Table 1). This result shows that anti-TNT mAb has sensitivity to TNT, TNB, NT and 2,6-DNT, and is highly sensitivity to TNT and TNB however it cannot detect RDX (cyclotrimethylenetrinitramine).
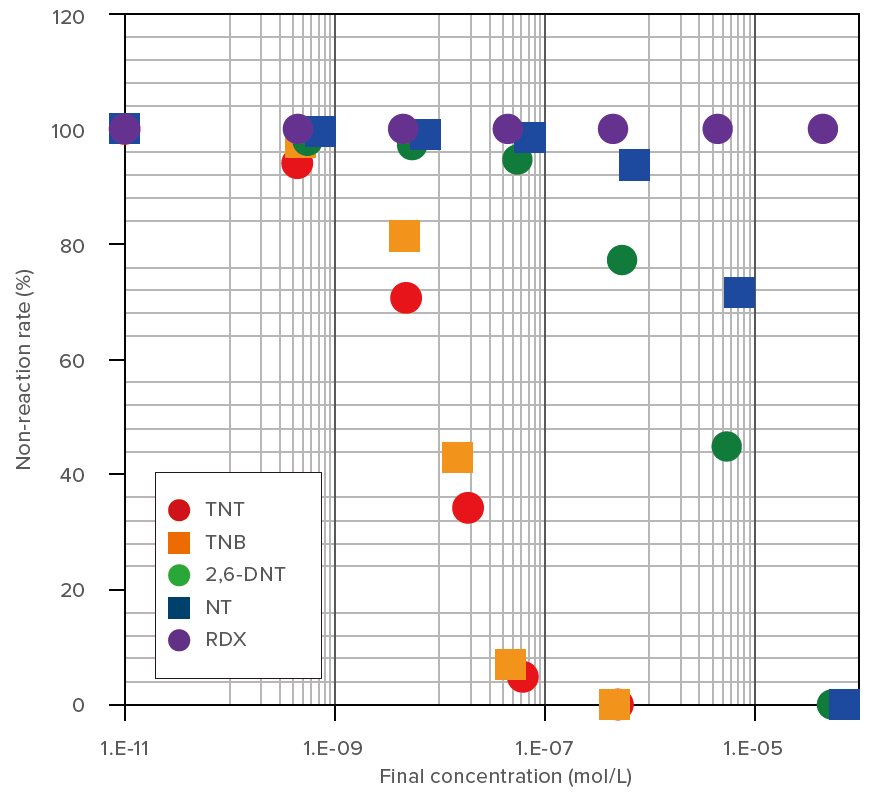
Figure 4. Dose-response curve for the immunocomplex formation of antibodies with TNT and other explosive compound formations.
These results demonstrate that anti-TNT mAb is a highly sensitive biosensor for nitro compounds without the requirement to use a fluorescent label.
Table 1. Analysis of binding of different explosive compounds to anti-TNT.
| Name | Structure | IC 50 (M) |
| TNT | 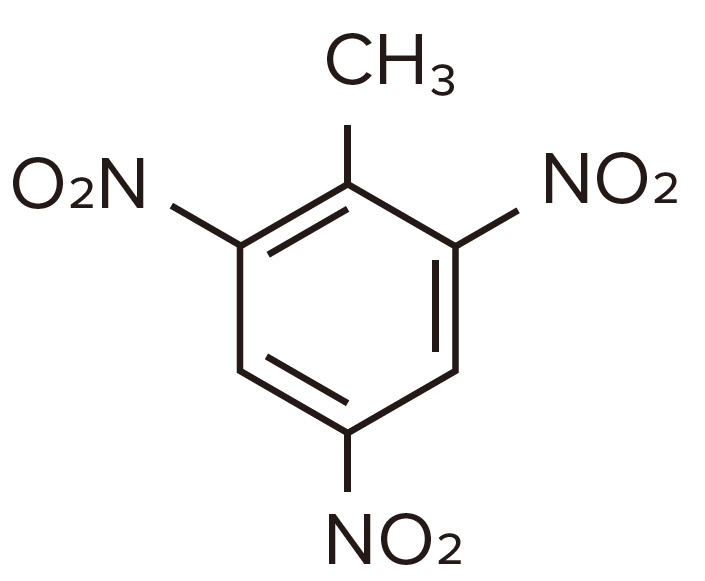 |
4.0 x 10⁻⁸ |
| TNB | 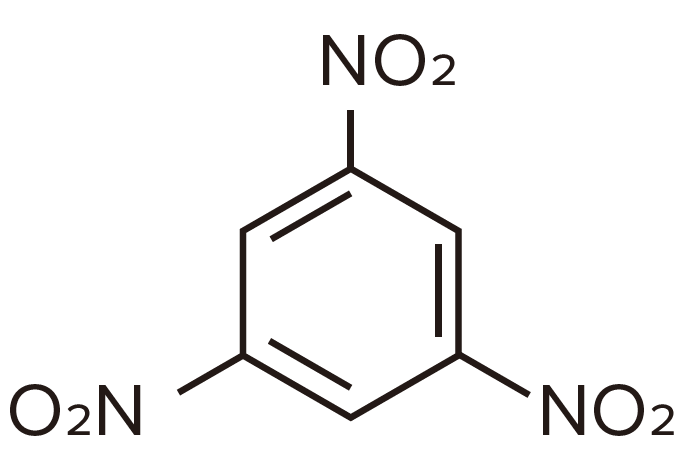 |
3.8 x 10⁻⁸ |
| 2,6-DNT | 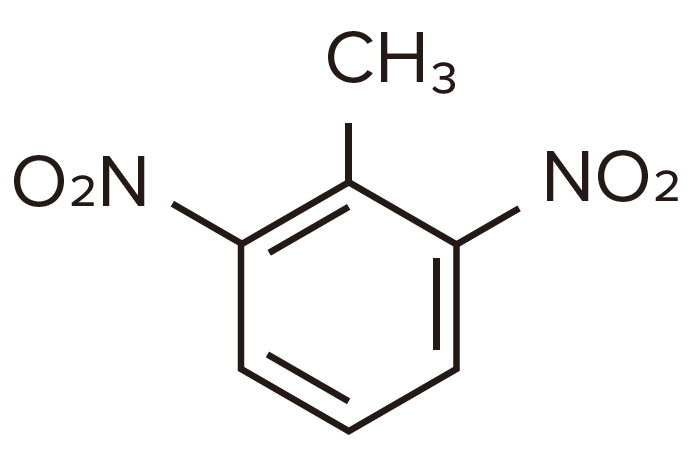 |
7.9 x 10 -6 |
| NT | 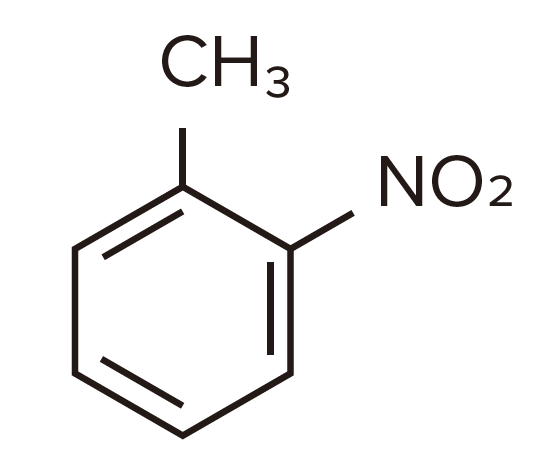 |
3.6 x 10⁻⁴ |
| RDX | 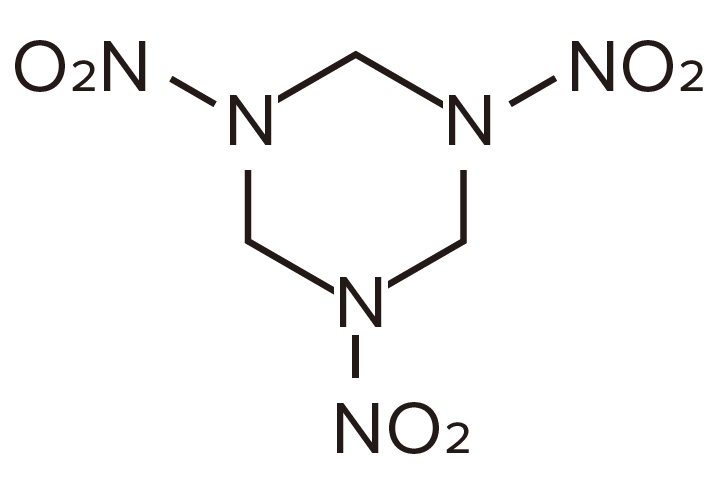 |
not detected |
References
Special thanks to Hiroshi Nakayama of Panasonic Corporation who assisted with the experiment.
1. Satoko Suzuki, Toshifumi Uchiyama, Ken-ichi Akao, Koushi Nagamori, Hiroshi Nakayama and Yuji Ito, TNT sensing using non-labeling FRET, Japan-Taiwan Medical Spectroscopy International Symposium/14th Annual Meeting of the Japan Association of Medical Spectroscopy, AWAJI, JAPAN 2016.
2. Leah Pandiscia received her PhD from Drexel University where she studied Biophysical Chemistry. She is a Spectroscopy Applications Scientist at JASCO.


