Introduction
For the room temperature analysis of Nylon (a polyamide synthetic fiber), sample preparation is made by dissolving samples in hexafluoroisopropanol (HFIP). However, a recent cost increase in HFIP has made this analysis more expensive and HFIP is considered environmentally unfriendly. The use of semi-micro separations has a significant advantage for this type of application by reducing the consumption of mobile phase.
To reduce analysis time and solvent consumption, smaller column sizes for rapid analysis are now available for use with GPC analysis.
In this article, the measurement of Nylon 6 films and fibers was performed using the RHPLC system with refractive index detector designed for use with semi-micro GPC columns offering high performance analysis. The solvent used is approximately 8 mL per analysis cycle and represents a 75% solvent saving compared with conventional analysis. The average molecular weight was calculated, and a molecular weight calibration curve was constructed using a polymethylmethacrylate (PMMA) standard.
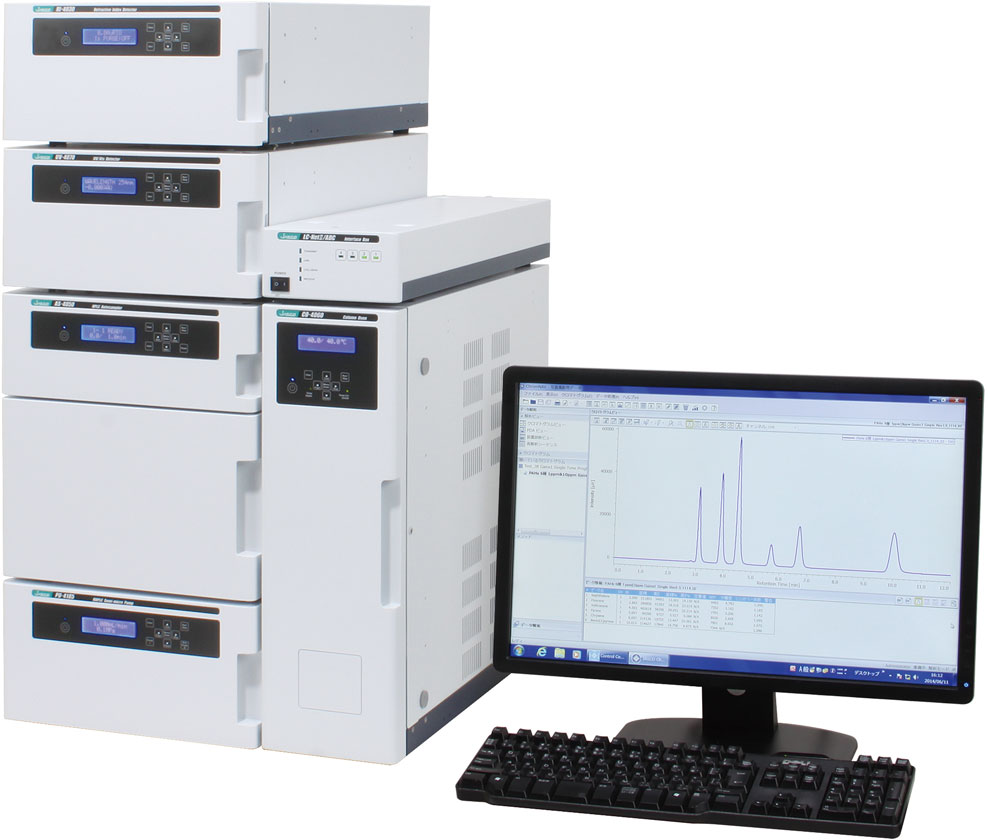
LC-4000 GPC system
Experimental
Chromatographic conditions
Column: 2x Shodex LF-404 (4.6mmI.D. x 250mmL, 6µm each)*1
Eluent: 5 mM Sodium trifluoroacetate in HFIP*2
Flow rate: 0.2 mL/min
Column temp.: 40ºC
Injection volume: 20 µL
Calibration standards for GPC: PMMA standards mixture (0.025 (w/v)% each in eluent)
PMMA STD (1); Mp 1520000, 211000, 21700, 2200
PMMA STD (2); Mp 772000, 51900, 6900, 645
Sample: 0.1 (w/v)% Nylon 6 film and fiber in eluent
Structure

Nylon 6
*1 The column dedicated for use with THF was replaced by HFIP.
*2 Degassing was performed by the batch, not online vacuum degasser.
Keywords
Nylon 6, HFIP, semi-micro scale, PMMA, GPC, Refractive index detector
Results
Figure 1 shows chromatograms of PMMA standard.
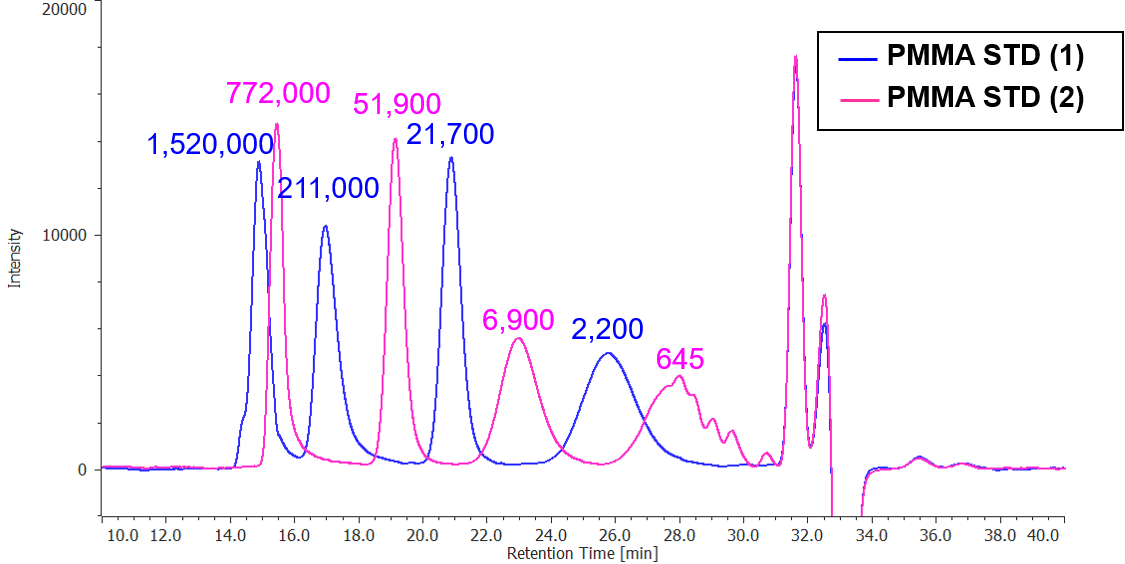
Fig. 1 Chromatogram of PMMA standard (The values on the chromatogram indicate the Mp, peak top molecular weight, for each PMMA standard)
Figure 2 shows the molecular weight calibration curve using PMMA standard.
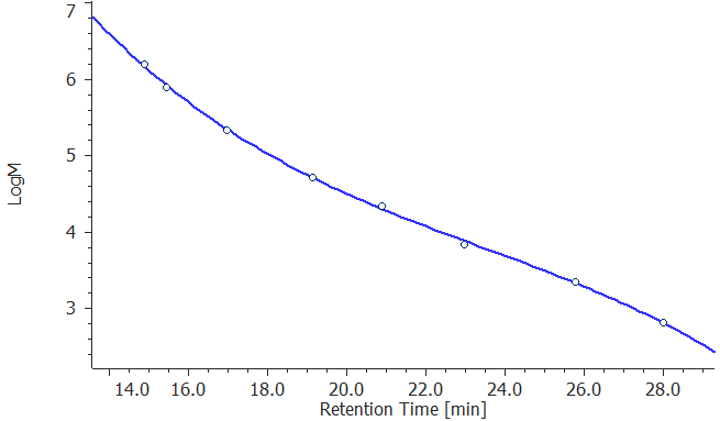
Figure 2. Molecular weight calibration curve by the PMMA standard.
Figure 3 displays the chromatogram of Nylon 6 film and molecular weight calibration curve, and its molecular weight distribution curve is in Figure 4.
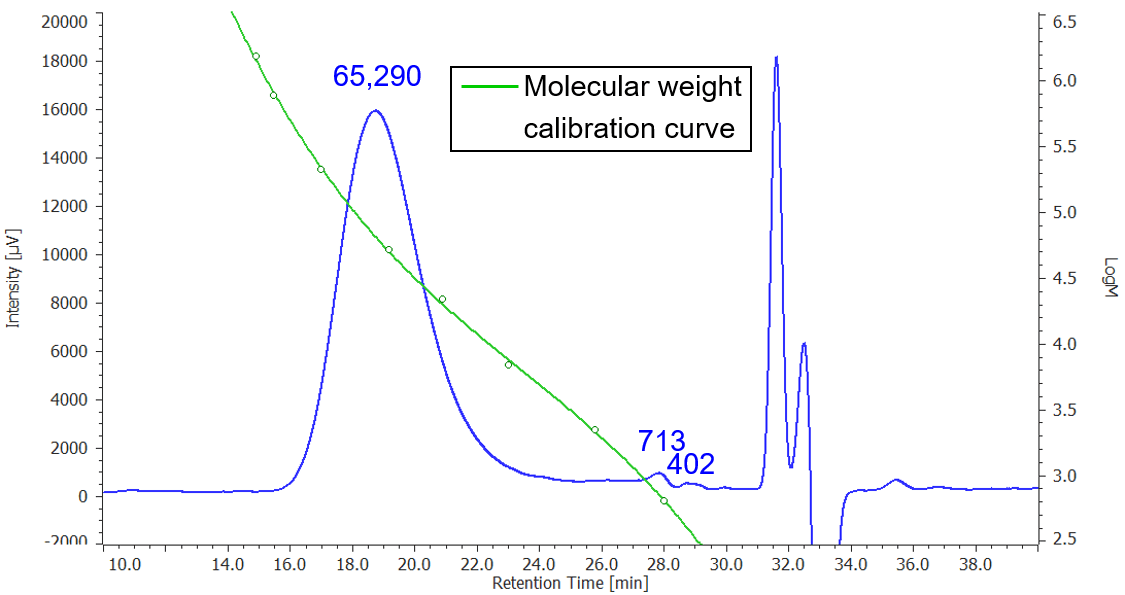
Figure 3. Chromatogram of Nylon 6 film and molecular weight calibration curve (The values indicate each Mp converted by PMMA)
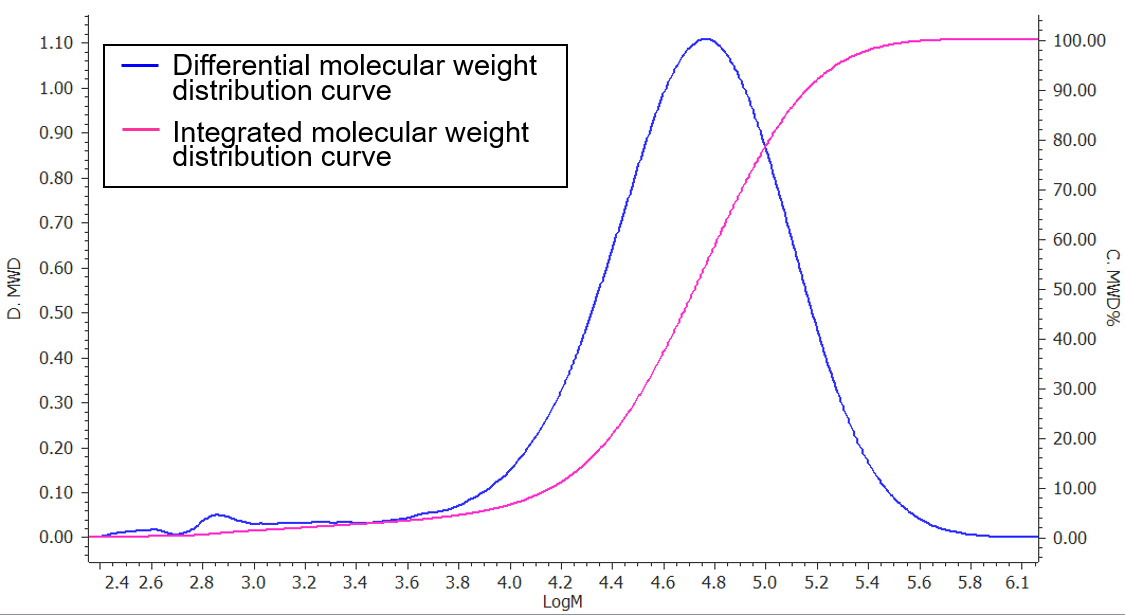
Figure 4. Molecular weight distribution curve of Nylon 6 film
Figure 5 is the chromatogram of Nylon 6 fiber and molecular weight calibration curve, and its molecular weight distribution curve is in Figure 6. Table 1 shows the result of each average molecular weight calculation converted to PMMA.
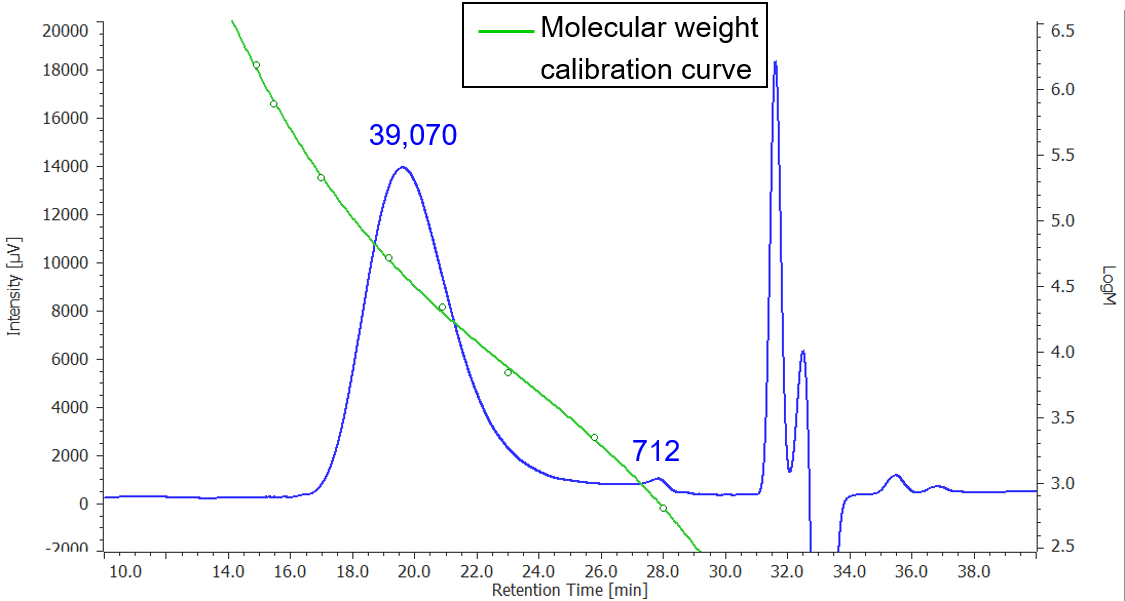
Figure 5. Chromatogram of Nylon 6 fiber and molecular weight calibration curve (The integrated indicate each Mp converted by PMMA)
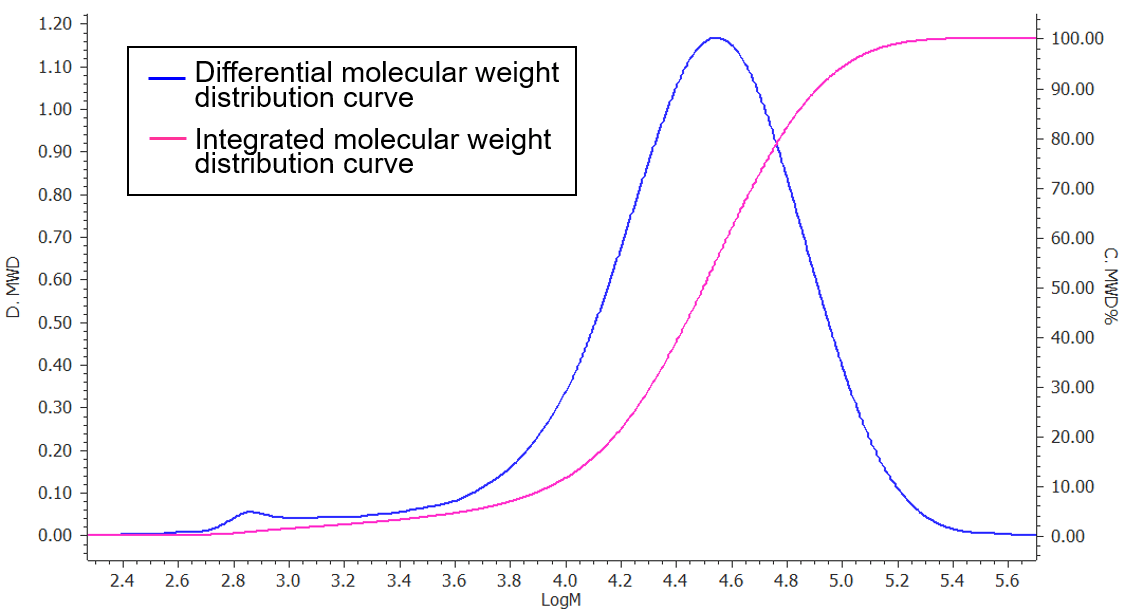
Figure 6. Molecular weight distribution curve of Nylon 6 fiber
Table 1 Average molecular weight calculation of Nylon 6 film and fiber converted by PMMA
| Mn | Mw | Mz | Mv | Mw/Mn | Mz/Mw | |
| Film | 16570 | 70258 | 130381 | 70258 | 4.24 | 1.86 |
| Fiber | 12854 | 40210 | 69148 | 40210 | 3.13 | 1.72 |


")
