Introduction
There are a number of food additives used in beverage to add good flavor and taste, good appearance, long shelf life, and nutritional enrichment. However, those food additives may have a bad effect on health if not properly controlled. Therefore, some countries have the regulation to secure the food safety.
In this article, food additives in functional beverage are measured and analyzed by Ultra High-performance Liquid Chromatography with Photodiode Array Detection, which enables high speed data acquisition rate at 100 spectra/sec.
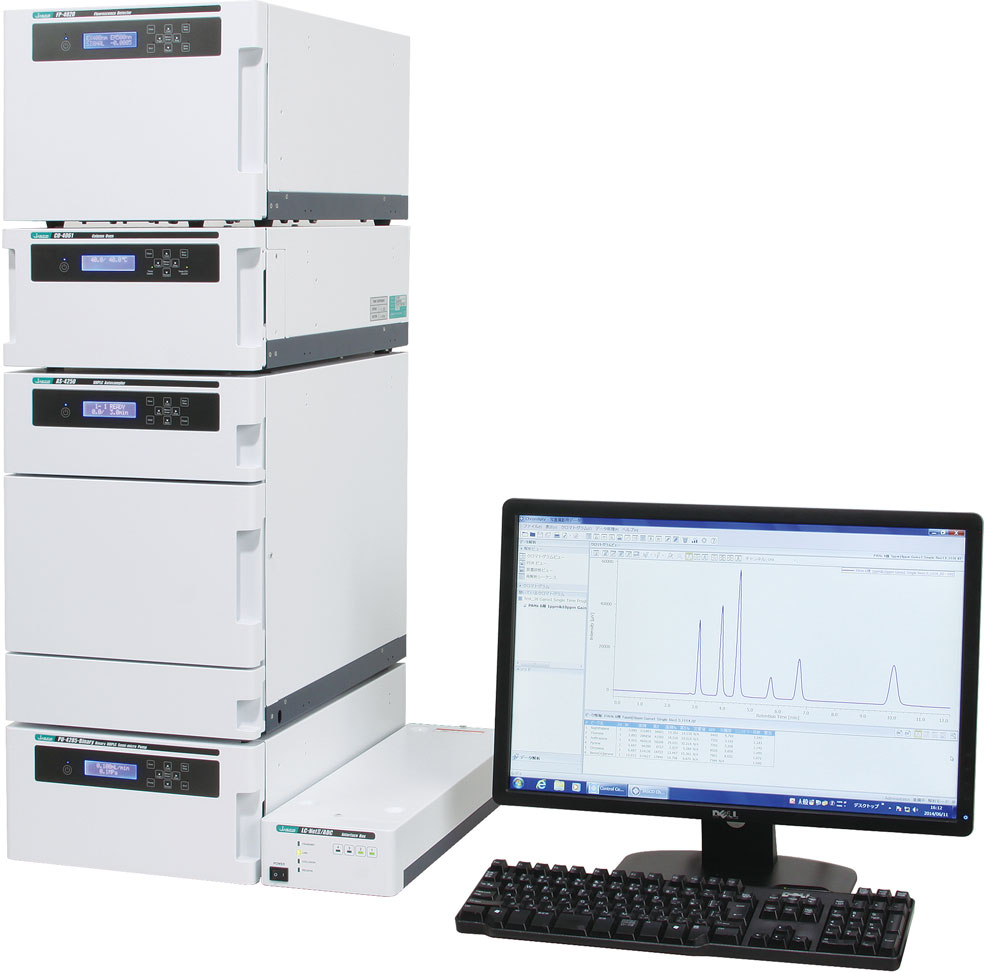
LC-4000 UHPLC system
Experimental
Chromatographic condition
Column: ZORBAX Eclipse Plus C18 (3 mmID x 50 mmL, 1.8 µm)
Eluent A: 0.3% Phosphoric acid solution
Eluent B: Acetonitrile
Gradient condition (A/B): 0 min(95/5) -> 1.2 min(82/18) -> 1.5 min(82/18) -> 2.0 min(77/23) -> 2.3 min(77/23) -> 5.0 min(35/65) -> 5.05 min(10/90) -> 5.05 min (10/90) -> 6.0 min(10/90) -> 6.05 min(95/5), 1 cycle 8.0 min
Flow rate: 0.8 mL/min
Column temp.: 40ºC
Wavelength: 200-650 nm
Injection volume: 1 µL
Standard sample: 12 Food additive standards
Results
The chromatogram and contour plot of the standard mixture of food additives are shown in Figure 1 and chromatograms at 4 different wavelengths are shown in Figure 2. 12 components are clearly separated within 5 min.
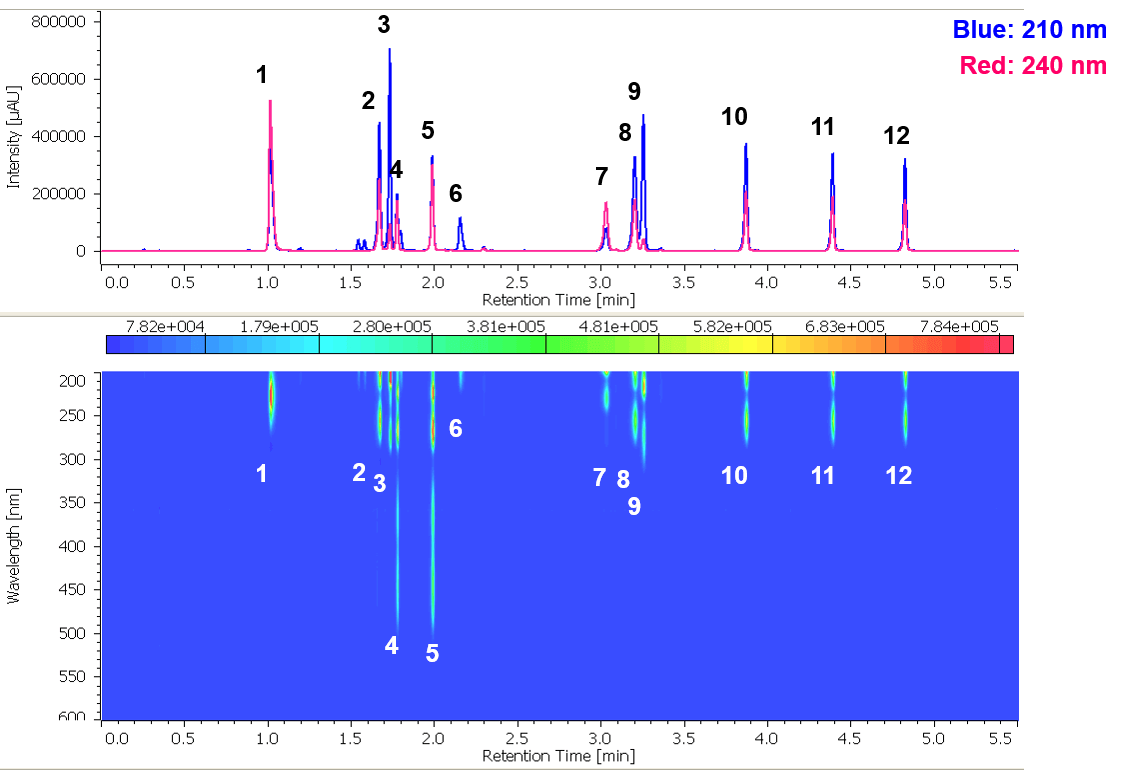
Figure 1. Chromatogram of standard mixture of food additives (1: Acesulfame K (0.2 mg/mL), 2: p-Hydroxybenzoic acid (0.05 mg/mL), 3: Caffeine(0.05 mg/mL), 4: Vitamin B2 sodium phsphate(Riboflavin sodium phsphate) (0.1 mg/mL), 5: Vitamin B2(Riboflavin) (0.1 mg/mL), 6: Aspartame (0.1 mg/mL), 7: Benzoic acid (0.05 mg/mL), 8: Methyl p-hydroxybenzoate (0.05 mg/mL), 9: Propyl gallate (0.05 mg/mL), 10: Ethyl p-hydroxybenzoate (0.05 mg/mL), 11: Propyl p-hydroxybenzoate (0.05 mg/mL), 12: Butyl p-hydroxybenzoate (0.05 mg/mL))
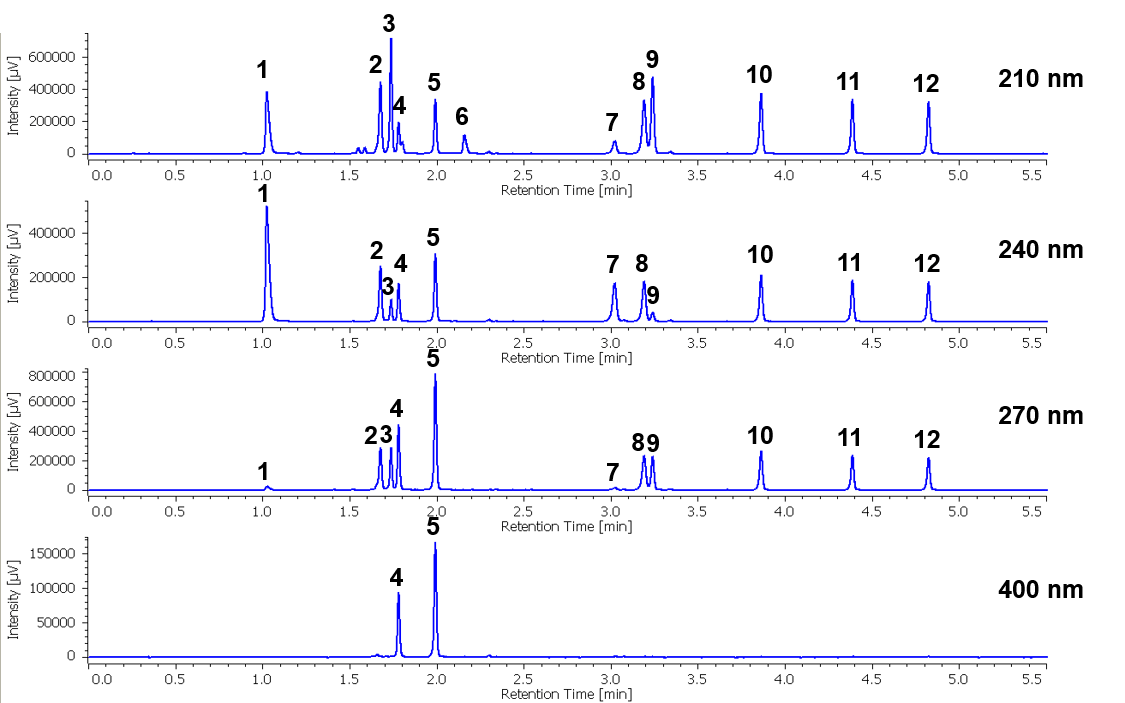
Figure 2. Chromatogram of the standard mixture of food additives at different wavelengths (The peak numbers and corresponding compounds are the same as in Figure 1.)
In Figure 3, the chromatogram and contour plot of a commercial functional beverage are shown and the chromatograms at 4 different wavelengths are shown in Figure 4.
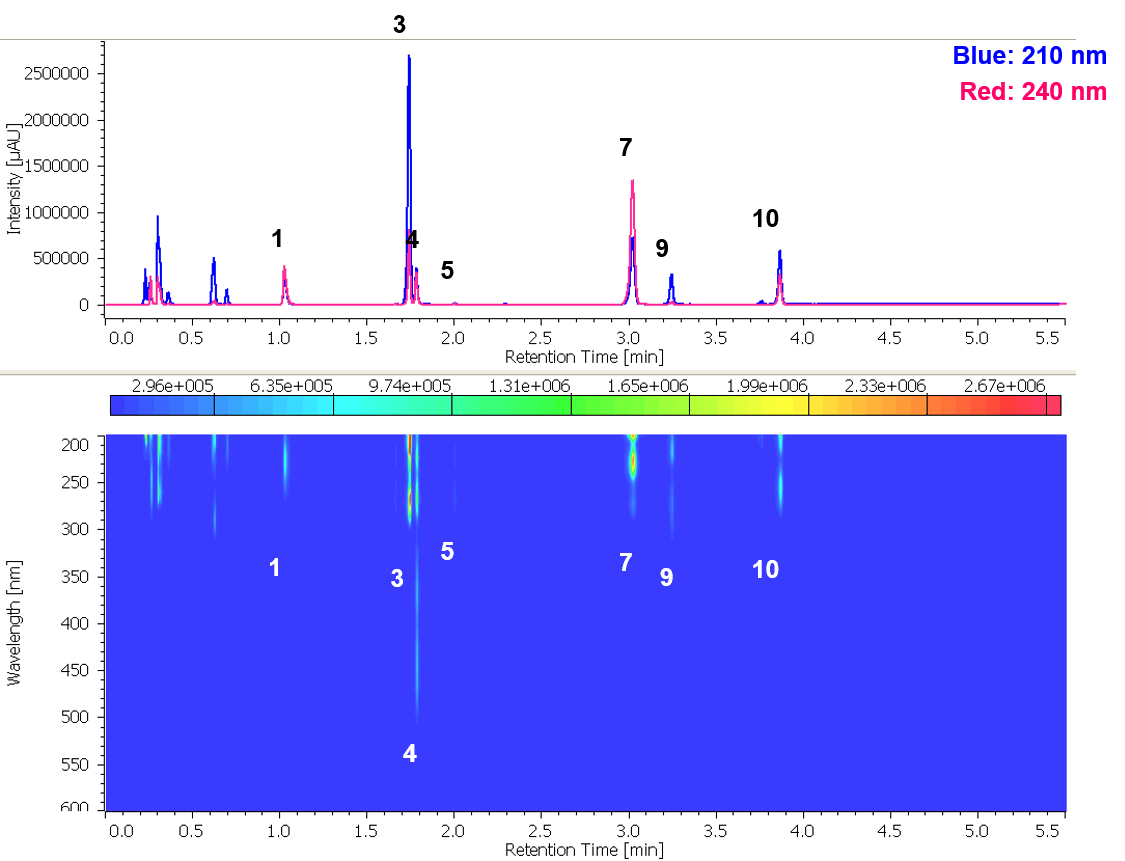
Figure 3. Chromatogram of a functional beverage (The peak numbers and corresponding compounds are the same as in Figure 1.)
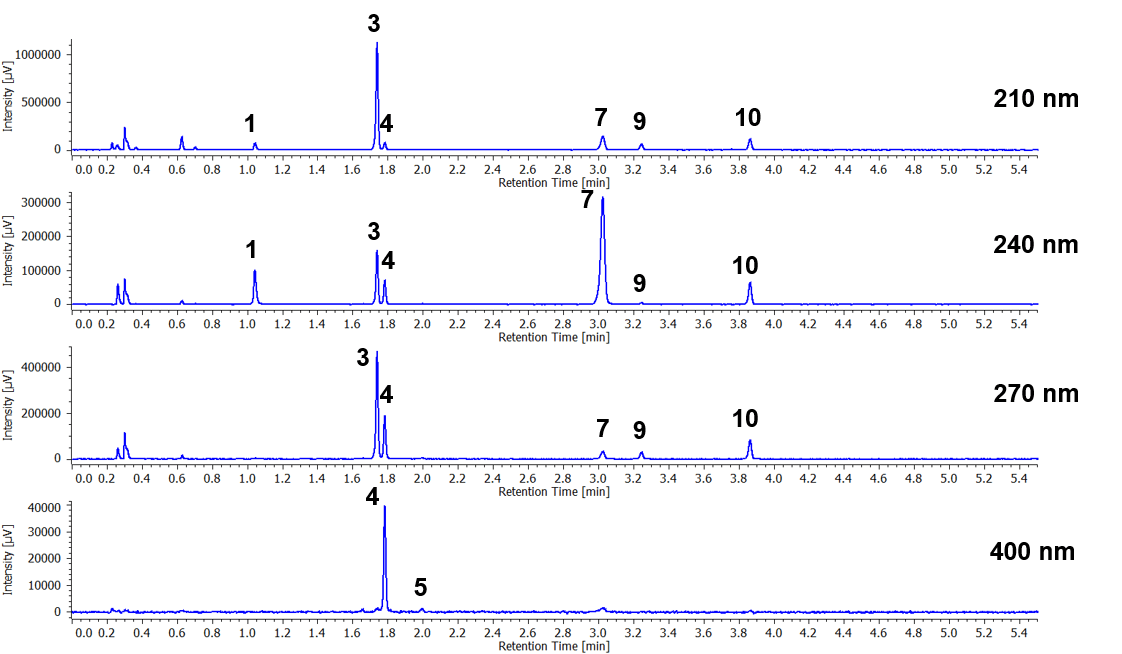
Figure 4. Chromatograms of the functional beverage at 4 different wavelengths (The peak numbers and corresponding compounds are the same as in Figure 1.)
Preparation. The commercial functional beverage was filtered with 0.2 mm membrane filter.


