Principles of CD/ORD (4): Applications of CD and ORD measurements

October 6, 2020

Here, the CD/ORD applications are divided into four types: organic compounds, optically active metal complexes, proteins and polypeptides, and nucleic acids.

Organic compounds

Identification of known optical isomers

The CD and ORD spectra of enantiomers form a complete mirror image, allowing identification of the configuration of optical isomers. Fig. 8 shows the CD spectrum of two optical isomers of α-pinene gas. It can be seen that the spectra are vertically symmetrical. Based on the ORD and CD spectra of optical isomers whose configuration is already known, analysis of optically active substances with similar structures can be performed.

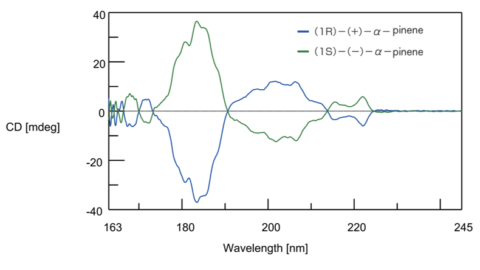
Fig. 8 CD spectrum of α-pinene gas

Analysis of configuration and conformation using empirical rules
The Cotton effect produced by the three-dimensional environment around the chromophore has been extensively investigated., and the rules of thumb for the major chromophores are shown in Table 2.

Table 2 Rules of thumb for the Cotton effect

Chromophore Transition λ ext [nm], Δε Rule of thumb
Saturated ketone n → Π* 290 to 305, 0 to 4 Octant rule of ketones
α, β-Epoxy Ketone
α, β-Cyclopropyl Ketone
n → Π* 280 to 307, 0 to 5 Reverse octant rule
β, γ-unsaturated ketone n → Π* 295 to 305, 0 to 10 Octant rule
α, β-unsaturated ketone n → Π*
Π → Π*
-
320 to 350, 0 to 3
230 to 250, 0 to 15
210 to 215, 0 to 15
Reverse octant rule,
Helix rule,
Allylic axial substitution rule
C = C double bond - 180 to 220, 0 to 10 Olefin octant rule,
Twist effect,
Allylic axial substitution rule
Conjugated diene Π → Π* 230 to 250, 0 to 10 Helicity rule,
Allylic axial substitution rule
Benzene ring Π → Π*, l L b
Π → Π*, l L a
260 to 280, 0 to 2
200 to 220, 0 to 5
Benzene sector rule

Exciton chirality method

If two or more equivalent chromophores with strong Π-Π* bands are present at asymmetric positions relative to each other, the twist direction determines the sign of the Cotton effect. This method is a theoretically established and versatile method, in which functional groups that do not show absorption, such as diols (2 -OH), are derivatized into a dibenzoate (Fig. 9) to determine the configuration.

Fig.9 Chirality of α-glycol dibenzoate

Metal complexes

Hexacoordinated octahedral optically active complexes

There have been many studies on optically active hexacoordinated octahedral complexes based on a comparison with the absolute configuration determined by X-ray structural analysis. Fig. 10 shows CD/ORD spectra of an optically active complex in which ethylenediamine is coordinated with trivalent cobalt ions. The ligands investigated have included substituted diamine, amino acid (bidentate), triamine (tridentate), and EDTA (hexadentate) complexes. Hexacoordinated octahedral complexes involving Co (III), Co (II) Cr (III), Ru (III), Rh (III), Pt (II), Ir (III), and Ni (II) have been studied.

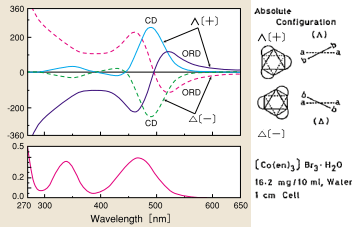
Fig. 10 ORD, CD, and UV spectra of optically active metal complexes

Proteins, polypeptides

From CD spectra, it is possible to estimate the basic structure of proteins, and the composition ratio of α-helices, β-sheets and random coils. Fig. 11 shows CD spectra of concanavalin A. In the natural state, it has a structure rich in β-sheets, but it is converted to a structure rich in α-helices by fluoroethanol (TFE). The figure shows spectra for concanavalin A in hydrochloric acid with a pH of 2, and a 50% TFE solution, indicating β-sheets and α-helix, respectively.

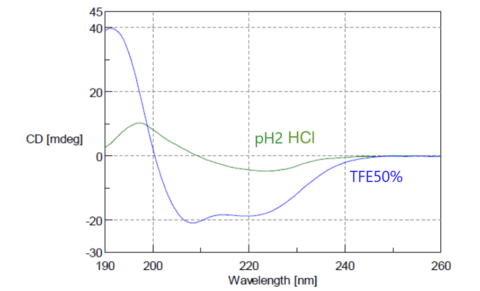
Fig. 11 CD spectrum of concanavalin A

Nucleic acids

Nucleic acids such as DNA known with a double helix structure, and RNA involved in protein synthesis, produce CD spectra reflecting their structure. One example is the discovery of left-handed Z-shaped DNA structures by CD measurements. The sign of the CD signal was the key to identifying the left- and right-handedness. The most common type of CD measurements for nucleic acids are temperature dependent measurements. It is possible to trace the melting process where the double strand of nucleic acid unwinds, and to analyze the thermal stability based on the structural changes.

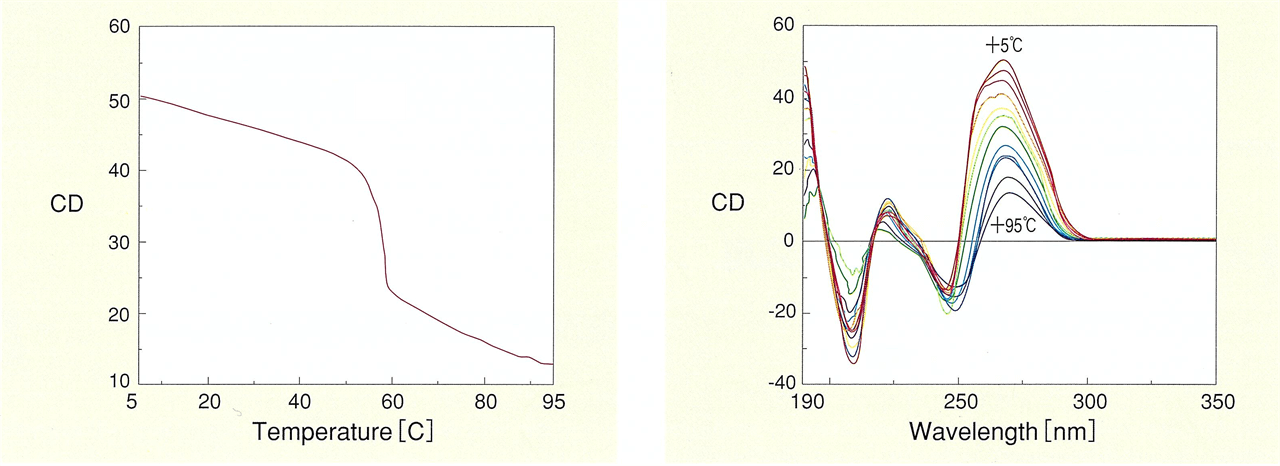
Fig. 12 DNA melting curve (left) and thermal stability of DNA double helix structure (right)