Introduction
In recent years the use of oligonucleotide based therapeutics derived from nucleic acids such as DNA or RNA, has increased significantly. They are considered to be next-generation drugs due to two important factors: firstly, they act not only on proteins that have traditionally been targeted by conventional small-molecule or antibody base drugs, but also on functional RNA such as mRNA and miRNA, and secondly they can be manufactured by chemical synthesis, which means that they can be easily mass produced. Oligonucleotide therapeutics are mainly based on artificial oligonucleotides that are chemically modified DNA or RNA, which improves their structural stability in the human body and affinity to their target molecules1). The evaluation of their interaction characteristics with target molecules and use as drugs, optimization of their number of the bases and sequence are critical. Thus, the importance of the examination and evaluation methods for the optimization of these properties has been well defined. The importance of the thermodynamic properties has been highlighted, and therefore an efficient method to analyze these characteristics is required.
This article reports the evaluation of the melting temperature and thermodynamic parameters of a nucleic acid sample. The absorbance at 260 nm was measured for different sample concentrations while ramping the temperature2) using a UV-visible spectrophotometer with Automatic 6/8-position Peltier cell changer, which can measure up to eight samples simultaneously.
V-730 UV/Vis spectrophotometer
Melting Temperature
When double-stranded DNA (dsDNA) is heated, interaction forces that contribute to the formation of double strand such as hydrogen bonding between the bases pairs is weakened, resulting in the separation of dsDNA into two single-stranded DNA (ssDNA). This dissociation is described as DNA melting (Figure 1), and the temperature at which a half of the dsDNA dissociates into ssDNA is defined as the melting temperature (Tm).
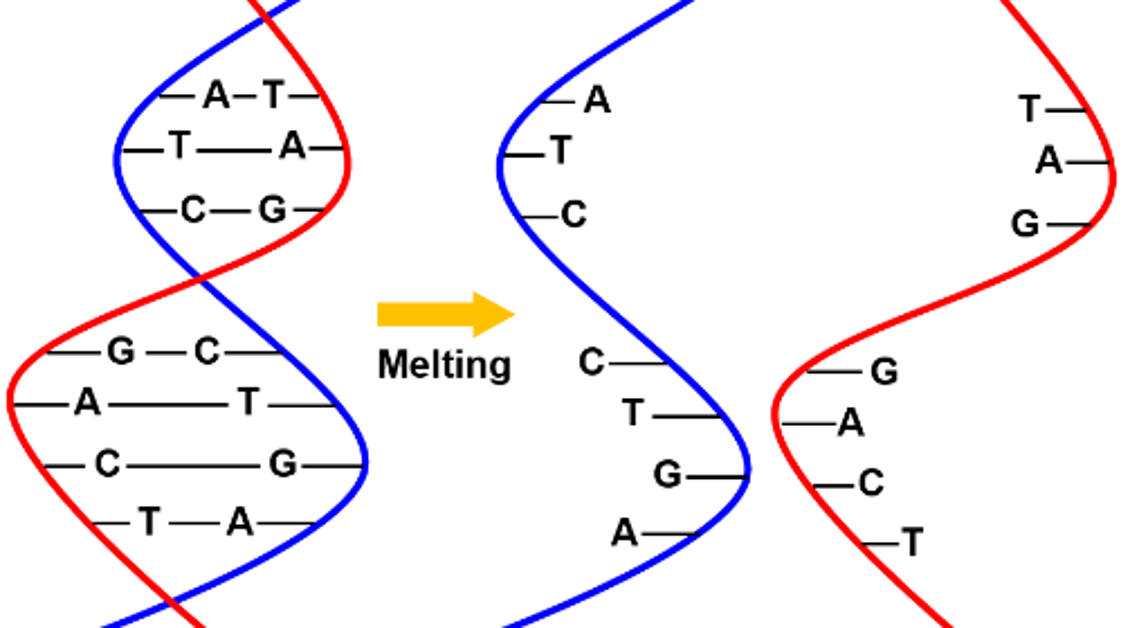
Figure 1. A schematic diagram of DNA melting
Nucleobases that compose DNA, RNA and artificial oligonucleotides almost all have an absorbance in the UV region, and usually with a peak maxima at around 260 nm. For example, in dsDNA, the bases are arranged with a stacking interaction, which makes the absorbance of the whole dsDNA smaller than the sum of the absorbance of each base. However, when dsDNA dissociates into ssDNA, the bases are no longer bonded resulting in a larger absorbance than for dsDNA. Using this phenomenon, the Tm can be calculated by measuring the absorbance in the UV region while ramping the temperature.
Thermodynamic Parameters
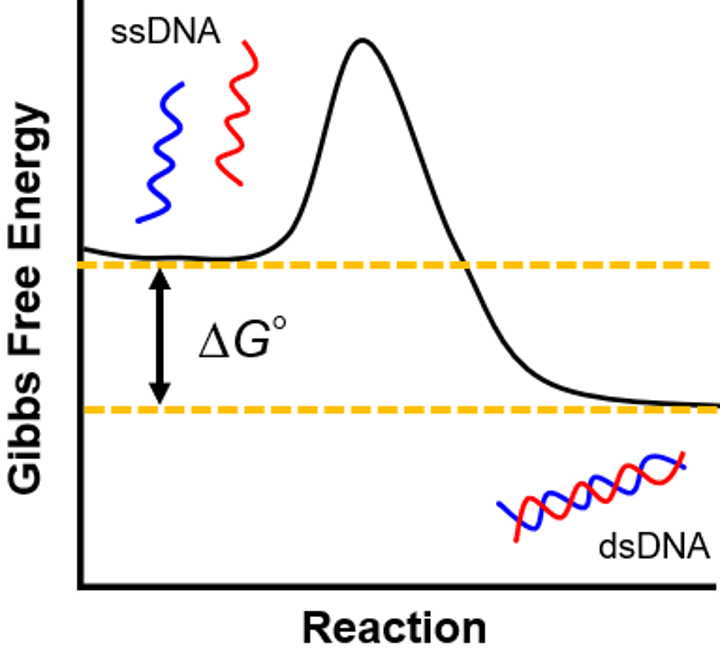
Figure 2. Free energy change of double helix formation of DNA
Free energy (∆G°) is expressed by the following equation, and a reaction or complex formation happens spontaneously when ∆G° is negative (Figure 2).
∆G°=∆H°-T∆S° (1)
It is well known that there is a correlation between enthalpy change (∆H°) and entropy change (∆S°) in most chemical and biological interactions. This correlation is described as the enthalpy-entropy compensation: when ∆H° is favorable (∆H°<0), ∆S° tends to be unfavorable, on the other hand, when ∆H° is unfavorable (∆H°>0), ∆S° tends to be favorable. Temperature only affects the term of entropy change. In forming dsDNA, the formation of hydrogen bonds and some other interactions result in a favorable ∆H° (<0), and a decrease in molecular disorder results in an unfavorable ∆S° (<0), thus -T∆S is positive. On the other hand, in the dissociation of dsDNA, the rise in temperature causes -T∆S° to be greater than ∆H° resulting in a positive ∆G°, which as a result causes the dissociation. As ∆H° becomes larger more duplex is formed, the less the molecular disorder gets the more unfavorable ∆S° becomes. This is the reason why the correlation is described as ‘compensation’.
In a molecular interaction and complex formation, it is considered to be enthalpy-driven when the effect of negative ∆H° on ∆G° is larger than that of negative ∆S°, on the other hand, when the effect of positive ∆S° on ∆G° overcomes that of positive ∆H°, it is considered to be entropy-driven (Figure 3).
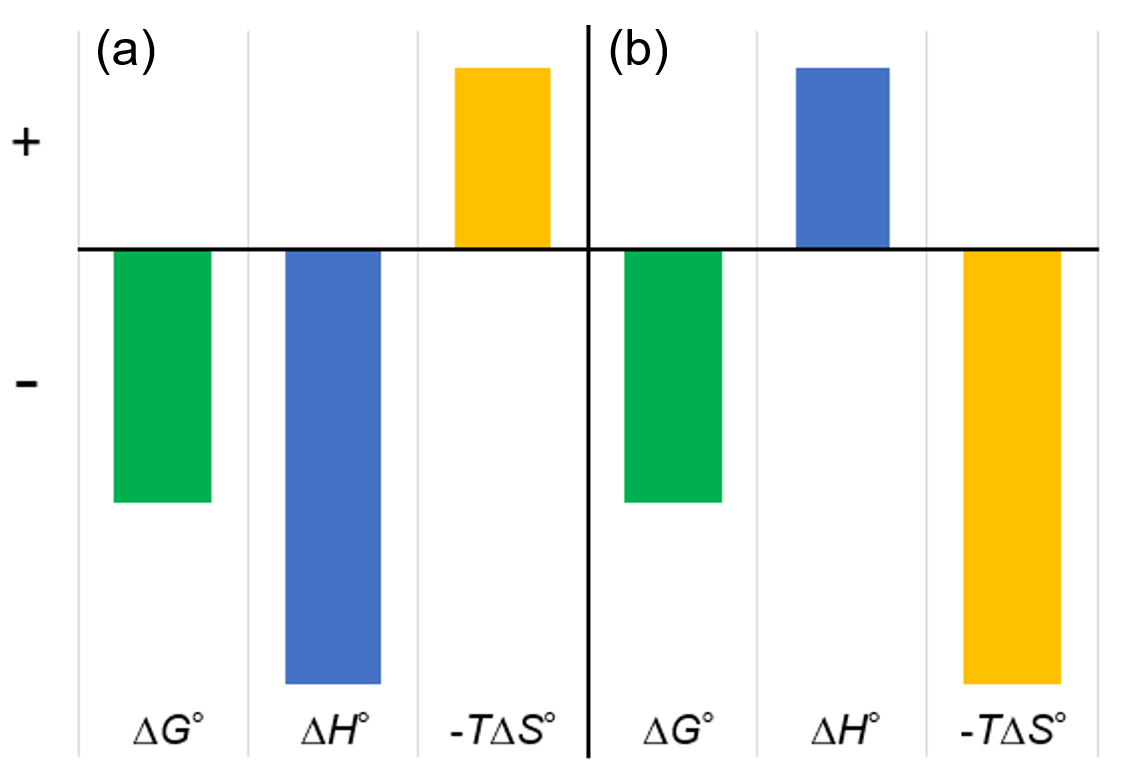
Figure 3. A schematic diagram of thermodynamic profiles of molecular interaction often found in biology. (a) Enthalpy-driven interaction in which hydrogen bonding is the driving force. (b) Entropy-driven interaction in which hydrophobic effect is the driving force.
In biomolecule interactions occurring in water, hydrogen bonding is often estimated to be the driving force of enthalpy-driven interactions, and the hydrophobic effect is estimated to be the driving force of entropy-driven interactions3),4). Therefore, the evaluation of ∆H° and ∆S° enables the estimation of the driving force and tendency of the interaction. As a result, it can be used in the estimation of complex formations and the molecular design of more stable complexes.
Experimental
The melting curves of 4 μmol/L, 8 μmol/L, 20 μmol/L and 40 μmol/L* of the nucleic acid (5’-TGCAAGACTATAAGATTC-3’) solution were measured. The measurements were conducted using a V-730 UV-visible Spectrophotometer with PAC-743 Automatic 6/8-Position Peltier Cell Changer. The samples were prepared in 8-position micro-cell. For the measurement and analysis, VWTP-959 Temperature Control Measurement/DNA Melting Analysis was used.
*These are the concentrations of ssDNA after dissociation of dsDNA.
Features of PAC-743 Automatic 6/8-Position Peltier Thermostatted Cell Changer
- Up to 8 samples are measured in a single run
- Very small amount of sample (e.g. 100 μL for 10 mm pathlength cell, 10 μL for 1 mm pathlength cell, etc.)
- Temperature is accurately monitored during measurement by probe sensor
- Preventing sample evaporation by sealing caps
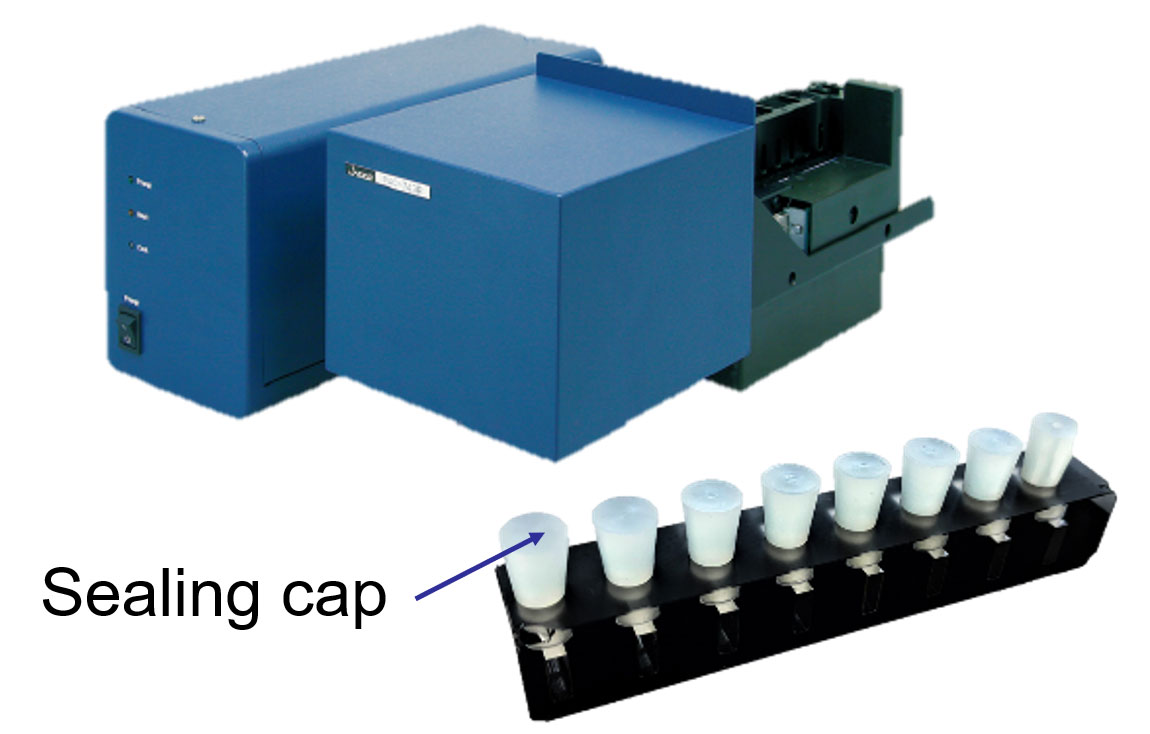
Figure 4. PAC-743 and 8-position micro-cell
Features of DNA Melting Analysis Program
- Calculation of Tm, ∆H°, ∆S°, and GC-content
- High-accurate calculation of thermodynamic parameters by 1/Tm vs. ln(Ct/4) plot**
- Analysis of both dsDNA composed of two sequence-identical strands and the one composed of two sequence-different strands
- Analysis of multiple data conducted at once
**Ct stands for the molar concentration of ssDNA
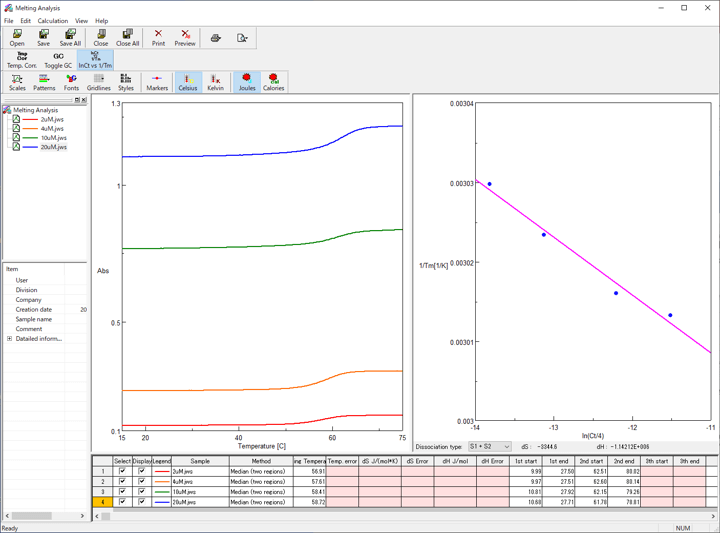
Figure 5. DNA Melting Analysis program
Melting curves of the nucleic acid were measured under the conditions shown below. The Tm of the sample was calculated from these curves, and ∆H° and ∆S° were calculated by 1/Tm vs. ln(Ct/4) plot.
Measurement Conditions
Wavelength: 260 nm
Response: 0.96 sec
Pathlength: 10 mm
Sample volume: 100 µL
Keywords
Oligonucleotide therapeutic, oligonucleotide, nucleic acid, thermodynamic parameter, enthalpy, entropy, PCR, Southern blot, intracellular environment, molecular crowding
Results
The melting curves for the different concentrations of nucleic acid are shown in Figure 6.
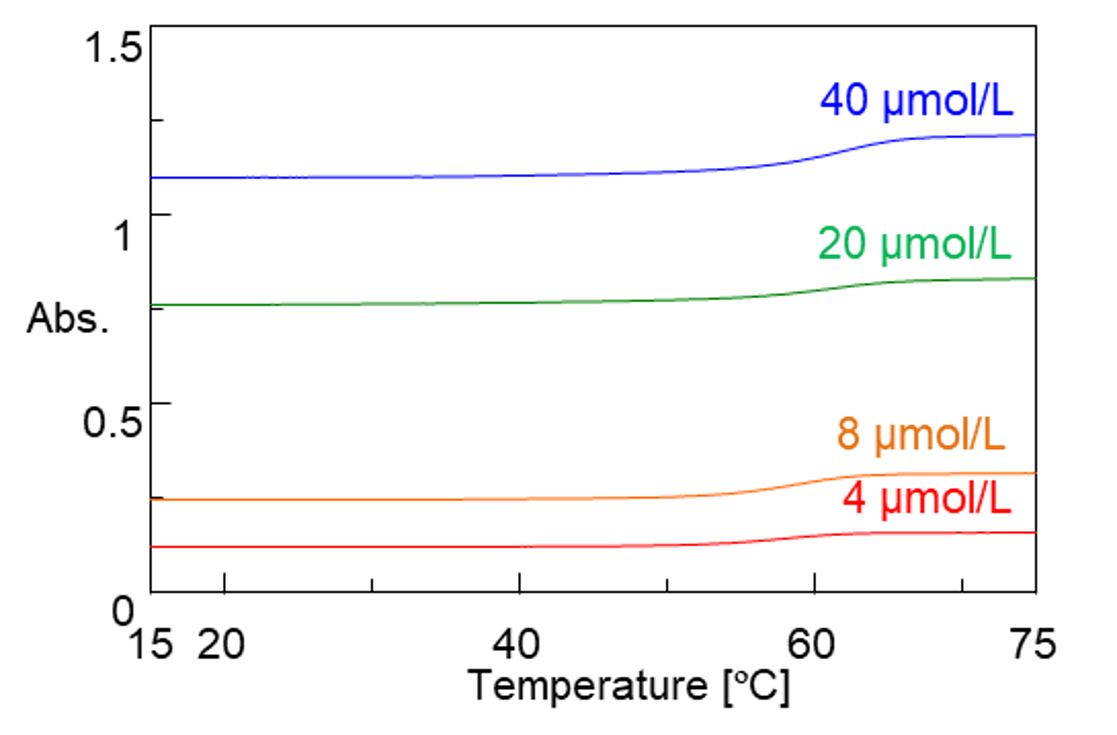
Figure 6. Melting curves
The Tm of each solution is shown in Table 1, and 1/Tm vs. ln(Ct/4) plot is shown in Figure 7. ∆H° and ∆S° are calculated from the approximate line of the plot; -578.0 kJ/mol and -1.635 kJ/(mol·K), respectively.
Table 1. Concentration and melting temperature of nucleic acid solutions
| Ct [mol/L] | Tm [ºC] |
| 4·10-6 | 57.2 |
| 8·10-6 | 58.1 |
| 20·10-6 | 59.8 |
| 40·10-6 | 60.8 |

Figure 7. 1/Tm vs. ln(Ct/4) plot
Conclusion
The results show that the enthalpy change greatly overcomes the entropy change in dsDNA formation of the nucleic acid solution. This indicates that dsDNA formation of the sample is enthalpy-driven, which suggests that the driving force of the formation is mainly hydrogen bonding and stacking interaction. This observation agrees with the mechanism of dsDNA formation discovered by Watson and Crick.
This article shows that the PAC-743 provides simultaneous measurements of multiple samples, while accurately monitoring the temperature. Also, evaluation of thermal stability of nucleic acid and stability of complex can be done by calculating Tm, ∆H° and ∆S° using the DNA Melting Analysis program. Needless to say, the evaluation of Tm is also important in the use of PCR (polymerase chain reaction) and Southern blot, which are well-used methods to duplicate or detect DNAs. Moreover, the evaluation of Tm and thermal parameters is key for the estimation of complex formation under a molecular-crowding environment, a pseudo environment of intracellular environment that has also been gathering attention.
Combination of PAC-743 and DNA Melting Analysis program is suitable for the efficient acquisition of useful information for the development of oligonucleotide therapeutics and for research methods based on the nature of DNA and double-helix formation.
References
- 1.S. Obika, Y. Kasahara, Folia Pharmacal. Jpn., 2016, 148, 100-104
- 2.N. Sugimoto, Gene and Biotechnology, Tokyo, Maruzen Publishing Co., Ltd., 1999
- 3.Y. Kitaou, T. Ohnuma, Kagaku to Seibutsu, 2015, 53(12), 834-842
- 4.K. Tsumoto, M. Ui, Yakugaku Zasshi, 2009, 129(11), 1311-1317
This application was developed under the guidance of Prof. Takehiko Wada of Institute of Multidisciplinary Research for Advanced Materials, Tohoku University.


