
Introduction
In recent years, the demand for glass used in smartphones, tablets, and other touch-panel devices has increased significantly. However, the susceptibility of glass to fracture under mechanical impact remains a major challenge. To address this issue, various forms of chemically strengthened glass have been developed.
Raman spectroscopy is a powerful, non-destructive, and non-contact analytical technique for investigating the structure and composition of glass materials. It has been applied to a wide range of glass characterization studies, including hydrogen concentration analysis1), identification of gas species trapped within bubbles, and evaluation of Si–O network structures. More recently, a research group led by Professors Nobuaki Terakado and Takumi Fujiwara of Tohoku University reported a novel Raman spectroscopic approach for evaluating the depth-dependent stress distribution in chemically strengthened glass with micrometer-scale spatial resolution 2).
In this application note, Raman measurements were performed on chemically strengthened and non-strengthened glass samples to evaluate depth-dependent structural changes and stress-related properties.
Experimental
Glass is known to fracture when subjected to tensile stress generated by mechanical impact. Chemically strengthened glass is designed to improve resistance to fracture by introducing compressive stress that counteracts externally applied tensile stress. A commonly used strengthening method is ion exchange, in which sodium ions (Na⁺), one of the major constituents of glass, are partially replaced by potassium ions (K⁺), which have a larger ionic radius. This substitution increases the ionic packing density near the glass surface, thereby generating a compressive stress layer.
In Raman spectra of glass, an increase in K⁺ concentration and the resulting compressive stress cause the A₁ peak near 1080 cm⁻¹ to shift toward higher wavenumbers. In addition, as the specific volume (the reciprocal of density) increases, the Boson peak, which appears near 50 cm⁻¹ and is characteristic of amorphous materials, shifts toward lower wavenumbers 3).
In this study, a Raman spectrometer equipped with a confocal optical system (Figure 1) was used to perform depth profiling measurements from the glass surface into the bulk material. Changes in K⁺ substitution and specific volume were compared between chemically strengthened and non-strengthened glass samples. To accurately capture the entire Boson peak profile, including its low-wavenumber tail, an ultra-low wavenumber filter capable of measurements down to 10 cm⁻¹ was employed.
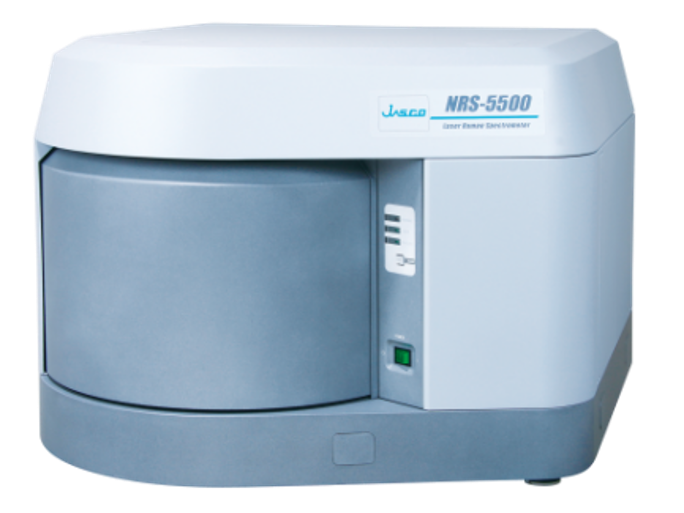
Fig. 1 NRS-5500 Laser Raman Spectrometer
Measurement Conditions
Instrument: NRS-5500 (Fig. 1)
Excitation wavelength: 532 nm
Laser intensity: Approx. 10 mW (at the sample surface)
Number of measurement points: 26
Measurement interval: 6 µm
(calculated assuming a sample refractive index of 1.5)
*In addition, an ultra-low wavenumber filter was used.
Results
Figure 2 shows the spectra of un-strengthened glass (left) and chemically strengthened glass (right) at depths of 6 µm (near the surface) and 150 µm (inner region) from the surface. While the spectral shape of the un-strengthened glass remained almost unchanged between the near-surface and inner regions, the chemically strengthened glass exhibited a high-wavenumber shift of the A1 peak near 1080 cm⁻¹ at the near-surface region and a low-wavenumber shift of the Boson peak near 50 cm⁻¹. This indicates that, whereas in un-strengthened glass there is no K+ substitution or generation of compressive stress, and the specific volume remains nearly constant between the surface and the inner region, in chemically strengthened glass, K+ substitution and the generation of compressive stress near the surface result in an increase in volume and specific volume.
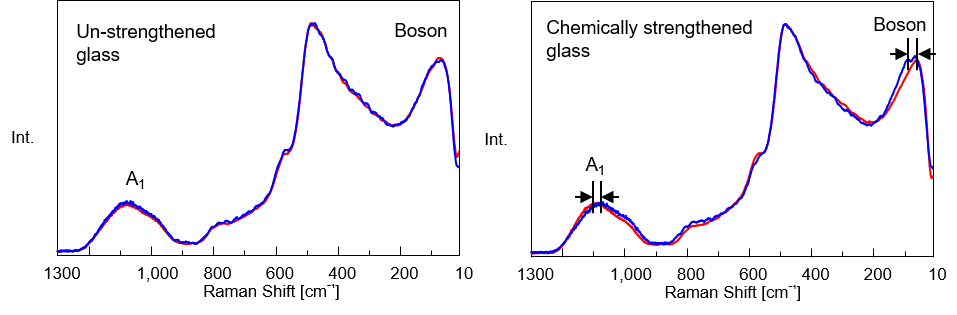
Fig. 2 Raman spectra of un-strengthened glass (left) and chemically strengthened glass (right)
(at depths of 6 µm (near the surface, red) and 150 µm (inner region, blue) from the surface)
(intensity on the vertical axis is normalized)
Furthermore, using a curve-fitting program, we accurately calculated the wavenumber of the A1 peak—which correlates with K+ concentration and compressive stress—by fitting it with a Gaussian-Lorentzian function, and plotted the results against depth (Fig. 3). While the peak position in un-strengthened glass remained nearly constant, in chemically strengthened glass, the peak near 1080 cm⁻¹ shifted to a higher wavenumber from the surface to a depth of approximately 70 µm, allowing us to quantitatively evaluate that the K⁺ concentration and compressive stress near the surface of chemically strengthened glass were high.
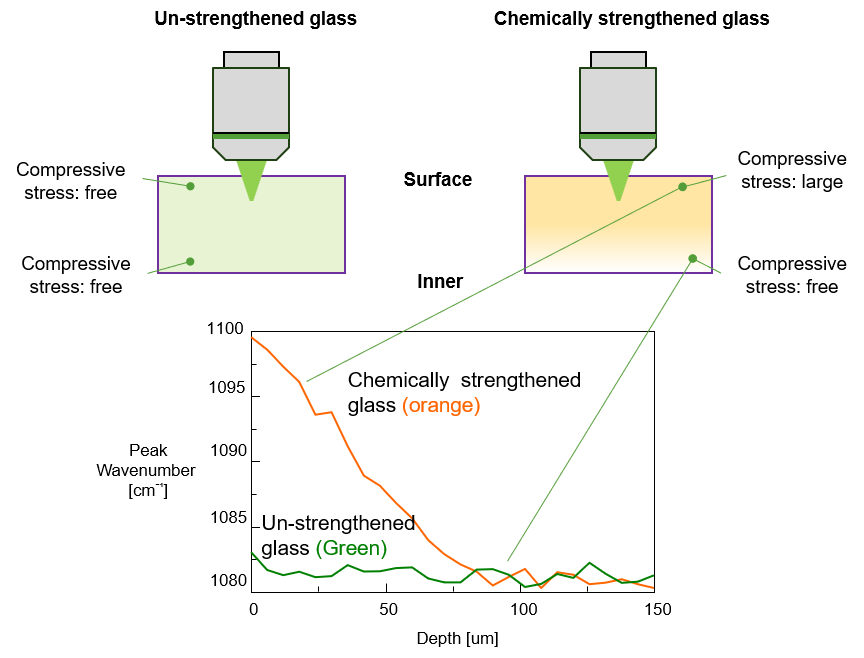
Fig. 3 Schematic diagram of stress in glass and a plot of peak positions near 1080 cm⁻¹
Conclusion
Using Raman spectroscopy, a non-destructive and non-contact analytical technique, it was possible to characterize depth-dependent variations in K⁺ concentration, compressive stress, and specific volume within chemically strengthened glass.
These results demonstrate that Raman spectroscopy is a powerful tool for evaluating the structural and stress-related properties of chemically strengthened glass. Furthermore, the ability to perform depth profiling with micrometer-scale spatial resolution is expected to contribute to the optimization of glass strengthening processes and the development of higher-performance glass materials.
References
1) JASCO Corporarion, Raman Application Data 230-AN-0035
2) N. Terakado, R. Sasaki, Y. Takahashi, T. Fujiwara, S. Orihara, Y. Orihara, Commun. Phys. 3, 37 (2020).
3) K. Nakamura, Y. Takahashi, M. Osada, T. Fujiwara, J. Ceram. Soc. Jpn. 121, 1012 (2013).
Acknowledgement
The glass samples used in this study were kindly provided by Professor Nobuaki Terakado of the Fujiwara Laboratory, Department of Applied Physics, Graduate School of Engineering, Tohoku University.
Related Posts:
 Analysis of Obsidian by Raman Spectroscopy:…
 Base Material and Dye Analysis - Combined Raman and…
 Analysis of Carbon Products using Raman Spectroscopy
 Analysis of the Solvation Structure of Concentrated…
 Quantitation of Glucose in Aqueous Solution using…
 Monitoring Microbial Fermentation using Raman Spectroscopy