Introduction
Key Points
It is possible to analyze solvation by measuring electrolytes sealed in vials or similar containers through the container itself under an inert gas atmosphere.
Raman spectroscopy provides information on molecular vibrations and rotations; in solution measurements, it allows for the observation of changes in molecular vibrations caused by the interaction between solute molecules and solvent molecules. In particular, it is used in the analysis of lithium-ion battery electrolytes to investigate the coordination state of solvent molecules with lithium ions.
Furthermore, Raman spectroscopy allows for measurements through containers—such as vials or quartz cells—that transmit excitation light and Raman-scattered light. This enables measurements through the container while the electrolyte for Li-ion batteries—which often requires protection from moisture—remains sealed under an inert gas atmosphere.
Here, based on the references, we prepared electrolytes ranging from 0 mol/L to 3.2 mol/L using lithium bis(trifluoromethanesulfonyl)imide (LiTFSI) as the electrolyte and N,N-dimethylpropionamide (DMPA) (Fig. 1) as the solvent, and we report the results of measurements performed using the macro-measurement unit while the samples remained sealed in vials1), a) .
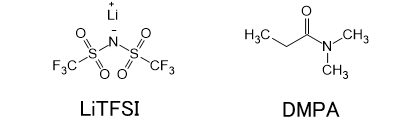
Figure 1 Structural formula of the sample
Experimental
Sample
Electrolyte: LiTFSI: Lithium bis(trifluoromethanesulfonyl)imide
Solvent: DMPA: N,N-dimethylpropionamide
Li-ion concentration (cLi)= 0, 0.2, 0.4, 0.6, 0.8, 1.0, 1.5, 1.7, 2.1, 2.3, 2.5, 2.7, 3.2 [mol/L]
System (Fig. 2)
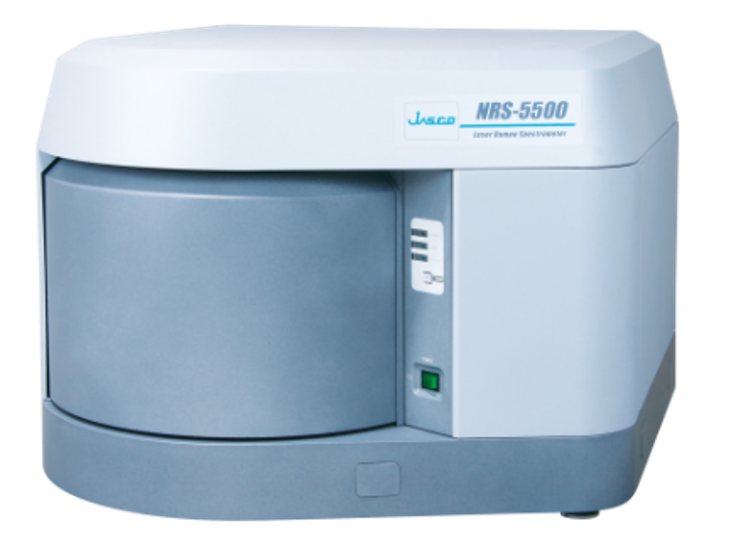
Equipment: NRS-4500 Laser Raman Spectrophotometer
Accessories: Macro Measurement Unit

Figure 2 (Left) NRS-4500 (Right) Macro Measurement Unit
Measurement Conditions
Excitation wavelength: 532 nm
Laser intensity: 30 mW
Grating: 2400 gr/mm
Slit: 10×1000 µm
Exposure time: 10 seconds
Accumulations: 2 times
Regarding the Coordination State
Figure 3 shows a schematic diagram predicting the coordination state of DMPA with Li ions2) . In low-concentration electrolytes where cLi is below a certain threshold, free DMPA molecules are abundant, and some of them coordinate with Li ions to form complexes (bound DMPA). Conversely, in high-concentration electrolytes, DMPA molecules are relatively scarce relative to Li ions. In this case, not only solvent molecules but also TFSI (anions) begin to coordinate directly with Li ions, forming complex cluster structures in which Li ions, solvent molecules, and anions are integrated. Such changes in the coordination structure of Li ions are thought to affect the electrical conductivity of the electrolyte.
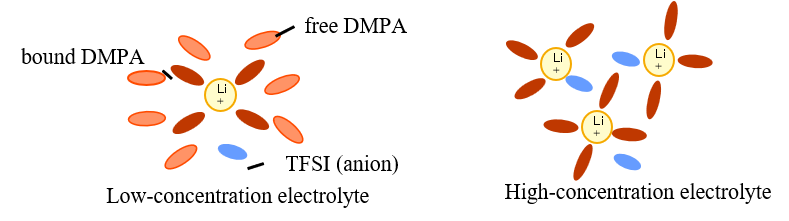
Figure 3 Schematic diagram of the coordination state
Therefore, to analyze these changes in coordination states, we measured the Raman spectra of electrolytes with different values of cLi. In particular, we focused on the DMPA and TFSI regions—which correlate with the coordination state of Li ions—and evaluated the spectral changes resulting from these cLi differences.
Keywords
Li-ion battery, LIB, electrolyte, concentrated electrolyte, solvation, degree of solvation, curve fitting, Raman spectroscopy
Results
Spectral Changes Due to Solvation in the DMPA and TFSI Regions
Figure 4 shows the Raman spectra of the DMPA and TFSI regions.
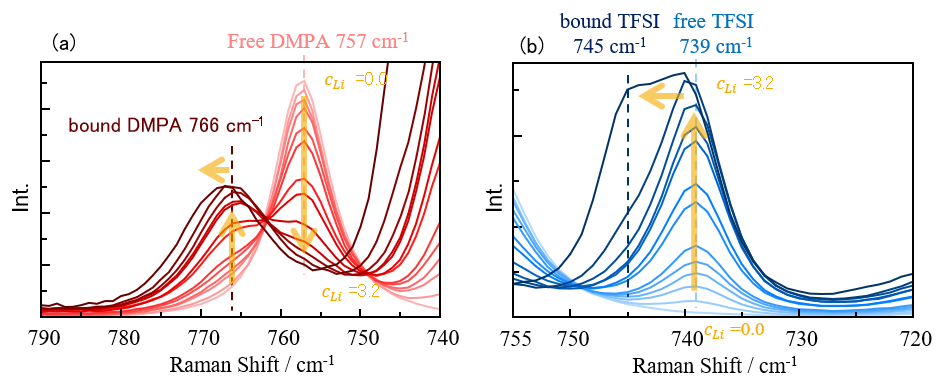
Figure 4 Raman spectra: (a) DMPA region; (b) TFSI region
DMPA (solvent)
The results in Figure 4(a) confirmed that the peak intensity at 757 cm-1, attributed to free DMPA, decreased as increased. On the other hand, the band at 766 cm-1, corresponding to bound DMPA, increased as cLi increased . Furthermore, at concentrations of cLi = 2.7 mol/L or higher, the peak for bound DMPA shifted toward higher wavenumbers.
TFSI (Anion)
From the results in Figure 4(b), it was confirmed that the peak intensity at 739 cm-1, attributed to free TFSI, increased with increasing cLi. Furthermore, at cLi ≥ 2.5 mol/L, bound TFSI was detected at 745 cm-1. The above changes are summarized in Table 1.
Table 1: Spectral Changes Accompanying an Increase in cLi
| Low-concentration electrolyte | High-concentration electrolyte | |
| DMPA (solvent) | Peak intensity of free DMPA decreases, while that of bound DMPA increases | The peak position of bound DMPA shifts toward higher wavenumbers |
| TFSI (Anion) | The peak intensity of free TFSI increases | Detection of the bound TFSI peak |
Based on these results, behavior different from that observed in low-concentration electrolytes—such as a peak shift in bound DMPA and TSFI peaks also were observed in high-concentration electrolytes, and we were able to capture the changes in the coordination state accompanying the increase shown in Figure 3 using Raman spectroscopy.
Estimation of the Solvation Number
Based on Equation (1) reported in the literature, we plotted the values of If/cT and cLi/cT in the range 0.0 mol/L ≤ cLi ≤ 2.3 mol/L—where, based on the results in Figure 4(b), the coordination of Li+ is considered to be unsaturated —and estimated the average solvation number of DMPA n(DMPA) from the slope and intercept of the approximate straight line1),3).
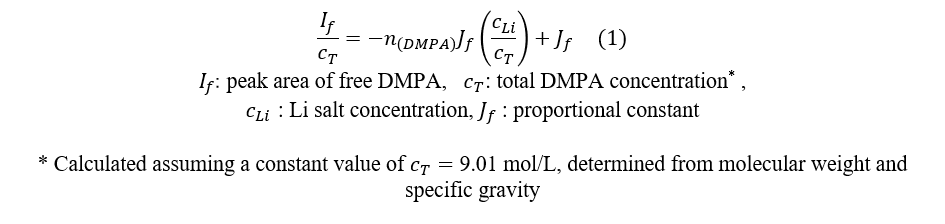
The If values were calculated by separating overlapping peaks using a curve-fitting program. Figure 5 shows the fitting results for a concentration of cLi = 1.0 mol/L as an example. The average solvation number was calculated from the slope of the best-fit line in the plot shown in Figure 6, yielding a value of n(DMPA) = 3.1. Since the average solvation number falls within the range 3 < n(DMPA) < 4, it is inferred that in the concentration range 0.0 mol/L ≤ cLi ≤ 2.3 mol/L, [Li(DMPA)₄]⁺ and [Li(DMPA)₃]⁺ exist in equilibrium as the main species.
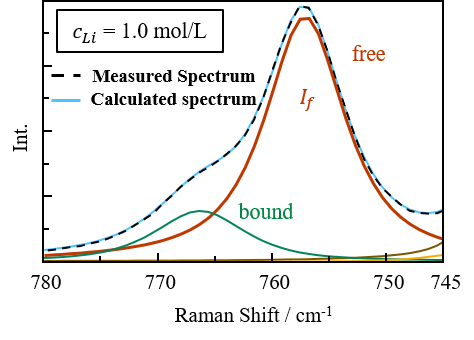
Figure 5 Spectrum after curve fitting
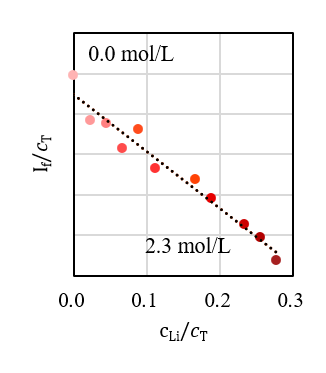
Figure 6 If/cT and cLi / cT plot in 0.0 mol/L ≤ cLi ≤ 2.3 mol/L
Conclusion
In this study, Raman spectroscopy was employed to analyze DMPA solutions containing LiTFSI at various concentrations. Changes in the Raman bands of DMPA molecules and TFSI anions with increasing Li salt concentration provided insight into the solvation structure and enabled estimation of the solvation number. These findings demonstrate the value of Raman spectroscopy as a powerful tool for the design and optimization of high-performance electrolyte materials.
In addition, all measurements were carried out directly through a vial using a macro measurement unit. Because this accessory requires neither special sample preparation nor precise focusing, it provides a simple and efficient approach for measuring liquid samples, making it particularly well suited for electrolyte analysis.
References
1) Kenta Fujii, Hiroki Fujino: Analytical Chemistry (Bunseki Kagaku), 67, 12 (2018). DOI: 10.2116/bunsekikagaku.67.727
2) Y. Yamada, A. Yamada: J. Electrochem. Soc., 162, A2406 (2015). DOI: 10.1149/2.0041514jes
3) Y. Umebayashi, T. Mitsugi, S. Fukuda, T. Fujimori, K. Fujii, R. Kanzaki, M. Takeuchi, S. Ishiguro: J. Phys. C., 111, 13028 (2007). DOI: 10.1021/jp076869m