
Introduction
< Key Points >
Raman spectroscopy, including the ultra-low wavenumber region, can be used to analyze amorphous materials.
< Introduction >
Raman spectroscopy is an excellent analytical technique that allows for the non-destructive and non-contact acquisition of information on molecular vibrations by irradiating a sample with a laser and detecting the scattered light. Furthermore, compared to infrared (IR) spectroscopy, it is widely used for the analysis of inorganic materials because it readily provides information on molecules composed of heavy atoms and on crystalline statesa),1) . Since Raman spectroscopy often yields strong signals from highly crystalline samples, it is widely used in the analysis of crystalline inorganic materials; however, measurement examples involving amorphous (non-crystalline) inorganic materials have been limited. One piece of information that characteristically appears in the spectra of amorphous solids is the Boson peakb),1) . It is known that the peak position of the Boson peak shifts toward lower as the specific volume (the reciprocal of density) increases2) . Therefore, by detecting the Boson peak, it is possible to analyze the packing density of atoms per unit volume in addition to information regarding molecular vibrations.
Since the Boson peak generally appears in the ultra-low wavenumber region of 60 cm-1 or less, measurements in this region are necessary for its detection. Here, we report on a case study in which we used an ultra-low wavenumber measurement unit capable of measurements down to 10 cm-1 to analyze the Boson peak and trace substances in obsidian and pitchstone, which are vitreous (amorphous) natural rocks.
About Obsidian
Obsidian is a type of volcanic rock—a glassy natural rock that solidified before the magma could crystallize. Varieties with high water content are distinguished as pitchstone. During the Stone Age, these rocks were highly valued as weapons, cutting tools, and jewelry, and were widely distributed throughout the country from their places of origin. For this reason, they attract attention not only from the perspective of earth sciences, such as volcanic research, but also from the field of archaeology, particularly in estimating places of origin and elucidating distribution routes. However, since the main component of all obsidian is SiO₂, differences between origins are not clearly discernible in Raman spectra within the standard wavenumber range, and the use of Raman spectroscopy has been limited until now.
Ultra-Low Wavenumber Measurements with a Raman Spectrometer
In Raman spectroscopy, it is essential to remove Rayleigh scattered light, which is scattered light at the same wavelength as the excitation wavelength (Raman shift of 0 cm-1). Here, we achieved measurements that include the ultra-low wavenumber region by using an ultra-low wavenumber measurement unit capable of measurements down to approximately 10 cm-1 to remove Rayleigh scattered light.
Experimental
Samples
Obsidian (Locations: Shirataki, Hokkaido; Kozushima, Tokyo; Gero,Gifu Prefecture; Himejima, Oita Prefecture; and Aso, Kumamoto Prefecture),
Pitchstone (locations: Shinshiro, Aichi Prefecture)
System
Instrument: NRS-5500 Laser Raman Spectrometer (Fig. 1)
Measurement Conditions
Excitation wavelength : 532 nm
Objective lens : 100 x
Grating: 1,800 lines/mm
Exposure time and number of exposures: 60 seconds x 2
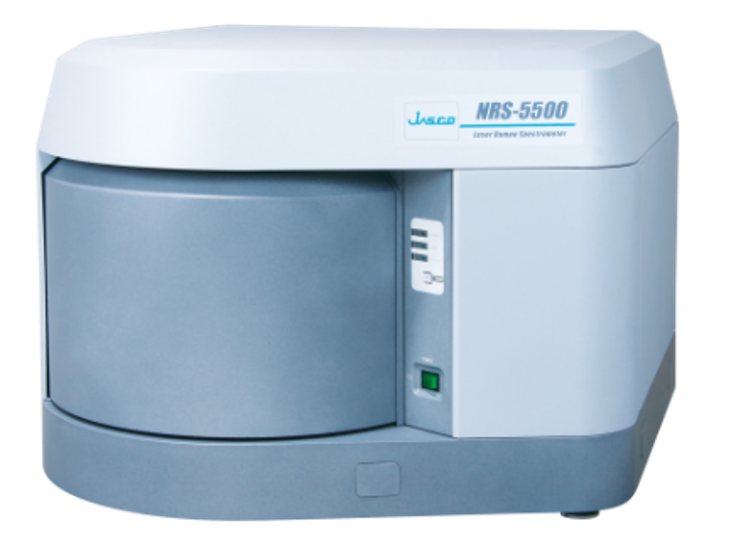
Figure 1 NRS-5500 Laser Raman Spectrometer
Keywords
Raman spectroscopy, ultra-low wavenumber, obsidian, amorphous, inorganic materials, boson peak
Results
Figure 2 shows the Raman spectra of in the 1000–10 cm-1 range. Broad bands attributed to Si-O were observed in the 600–300 cm-1 range in the spectra from all sources. These bands are attributed to the Si-O-Si network and are known to correlate with the size of the ring structures formed by Si-O-Si bonds. Since Si-O signals are generally weak in Raman spectroscopy, it is effective to combine it with infrared (IR) spectroscopy—a complementary technique—when performing analyses based on Si-O information3). Additionally, in the Gero obsidian, a band attributed to feldspar was identified near 510 cm-1. Furthermore, in obsidian from Aso, a band attributed to magnetite (Fe3O4 ) was observed near 670 cm-1. In other words, it was found that, unlike rocks from other localities, obsidian from Aso and Gero contains trace amounts of crystalline phases formed within the amorphous glass. On the other hand, in the region above 100 cm-1 , no clear differences were observed compared to rocks from other localities.
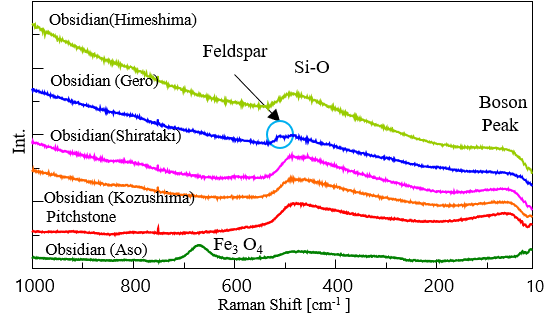
Figure 2 Raman spectra of obsidians and pitchstone
Focusing on the ultra-low wavenumber region (Figure 3), broad bands with peak tops at 60 cm-1 or below were observed in obsidian from all sources except Aso. These are Boson peaks, a characteristic feature unique to amorphous solids. Here, the peak positions were calculated using curve fitting. The wavenumber positions of the detected Boson peaks are shown in Table 1. Interestingly, the wavenumber positions of the Boson peak varied by origin. Gero obsidian was notably shifted toward higher wavenumbers at approximately 57 cm-1, while resin rock and Kozushima obsidian were at approximately 50 cm-1, and Shirataki and Himejima obsidians were at approximately 45 cm-1. Since the detected peak positions shift toward the lower wavenumber side as the specific volume increases (density decreases), this suggests that the Gero obsidian has a higher degree of order in its Si-O structure compared to other obsidians. Until now, the chemical composition of obsidian has been widely analyzed using elemental analysis methods such as X-ray fluorescence; however, the use of Raman spectroscopy, which covers the ultra-low wavenumber region, has demonstrated the potential to identify the molecular-level internal structure of the glassy matrix—a feature not discernible from chemical composition alone. Since Raman spectroscopy is a scattering measurement technique, it has the advantage of enabling non-destructive, non-contact analysis of samples. For this reason, it can be considered a promising analytical method for samples where non-destructive analysis is preferred, such as stone tools excavated from archaeological sites.
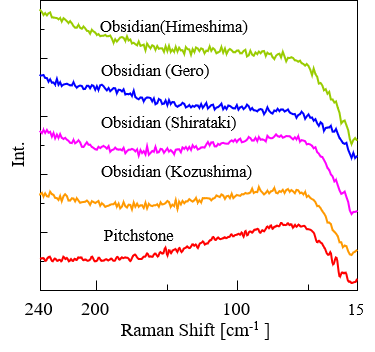
Figure 3 Raman spectra of obsidians and pitchstone showing detected Boson peaks
Table 1 Wavenumber positions at which Boson peaks were detected
| Sample | Peak Position [cm-1 ] |
| Obsidian (Aso) | Not detected |
| Obsidian (Gero) | 57.4 |
| Pitchstone | 49.6 |
| Obsidian (Kozushima) | 49.5 |
| Obsidian (Shirataki) | 45.7 |
| Obsidian (Himeshima) | 45.5 |
Conclusion
In this study, we measured Raman spectra using an ultra-low wavenumber measurement unit, covering the ultra-low wavenumber region around 10 cm-1. The results demonstrated that the Boson peak observed in the region below 60 cm-1 serves as an effective identification indicator for amorphous samples such as obsidian. While Raman spectroscopy has long been widely used for the analysis of crystalline inorganic minerals, the acquisition of spectra that include the ultra-low wavenumber region is expected to lead to its widespread use as a non-destructive, non-contact analytical method for structural analysis of natural glass and amorphous materials as well.
References
- M. Tsuboi, K. Tamura, R. Kitanaka, H. Oka, K. Akao, Y. Ozaki: Appl. Spectrosc., 78, 186 (2024). DOI: 10.1177/00037028231219026
- N. Terakado, R. Sasaki, Y. Takahashi, T. Fujiwara, S. Orihara, Y. Orihara, Commun. Phys. 3, 37 (2020). DOI: 10.1038/s42005-020-0305-7
- K. Tamura, M. Tsuboi, K. Furukawa, K. Akao, H. Sato, Y. Ozaki: Appl. Spectrosc., 79, 1356 (2025). DOI: 10.1177/00037028251333469
Acknowledgments
In developing this application, we received guidance and samples from Professor Emeritus Yukihiro Ozaki of Kwansei Gakuin University, Professor Motohiro Tsuboi of Kwansei Gakuin University, Professor Kuniyuki Furukawa of Aichi University, and Professor Harumi Sato of Kobe University. We would like to take this opportunity to express our deepest gratitude to them.
Related Posts:
 Fluorescence Observation and Foreign Materials…
 Orthogonal Assessment of Polymer Materials Including…
 Combined Analysis of Thermochromic Materials -FT-IR…
 Increased Productivity of Chiral Separation in…
 Base Material and Dye Analysis - Combined Raman and…
 Analysis of Carbon Products using Raman Spectroscopy