Introduction
Key Points
It is possible to easily numerically evaluate complex color changes for a sample using a color evaluation program.
< Introduction >
Colorants are a type of food additive and are regulated by the laws and regulations of each country. In recent years, naturally derived additives have gained attention due to increasing consumer awareness of food safety. Butterfly pea extract (Figure 1) is a natural colorant with a vivid hue that changes with pH due to the presence of ternatin, a type of anthocyanin (Figure 2).
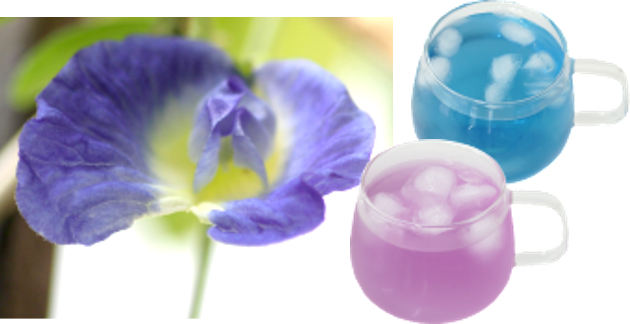
Fig. 1 Butterfly pea flower and its herbal tea
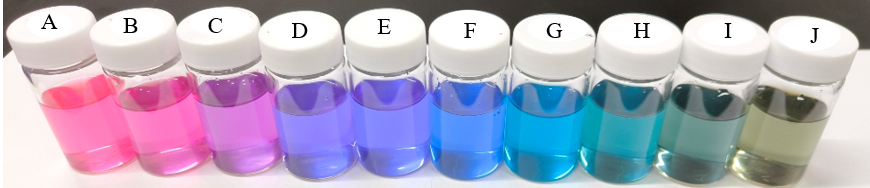
Fig. 2 Color of butterfly pea flower extracts with different pH values
Butterfly pea flower extract was added to the United States Food and Drug Administration (FDA) list of color additive certification exemptions published in 2021, and its use is expected to expand. In this report, we present the results of absorption measurements for butterfly pea extract at different pH using a JASCO UV-visible spectrophotometer, and objectively evaluate its color development using the JASCO color evaluation program.
Experimental
Sample
Butterfly pea extract solutions with different pH values: The components of dried butterfly pea petals were extracted into pure water, and ten samples with equal concentrations of butterfly pea extract were prepared. To adjust the pH, the same amount of either dilute hydrochloric acid, citric acid solution, sodium citrate buffer solution, sodium citrate solution, or sodium hydroxide (NaOH) solution was added. The concentration was adjusted using pure water. The pH of each solution was measured using a pH meter.
Table 1 Added liquids and pH values for butterfly pea extract
| Sample | A | B | C | D | E | F | G | H | I | J |
| Added liquid | Dilute hydrochloric acid | Citric acid | Citric acid | Citrate buffer | Pure water | Citrate buffer | Sodium citrate | NaOH | NaOH | NaOH |
| pH | 0.6 | 2.3 | 2.9 | 4.0 | 5.0 | 6.0 | 7.1 | 7.8 | 9.8 | 12.1 |
System
Instrument: V-750 UV-Visible spectrophotometer
Software: VWCD-960 Color evaluation (color diagnosis) program
Parameters
Measurement range: 780 nm – 450 nm
Data interval: 0.2 nm
Bandwidth: 1.0 nm
Response: 0.06 sec
Scan speed: 400 nm/min
Path length: 10 mm
Keywords
Natural colorant, dye, butterfly pea, food additive, spectrophotometer, anthocyanin, pH, color evaluation
Results
The absorption spectra of butterfly pea extracts with different pH values in the visible wavelength region are shown in Figure 3. The pH dependence of the intensity of different absorption bands is plotted in Figure 4.
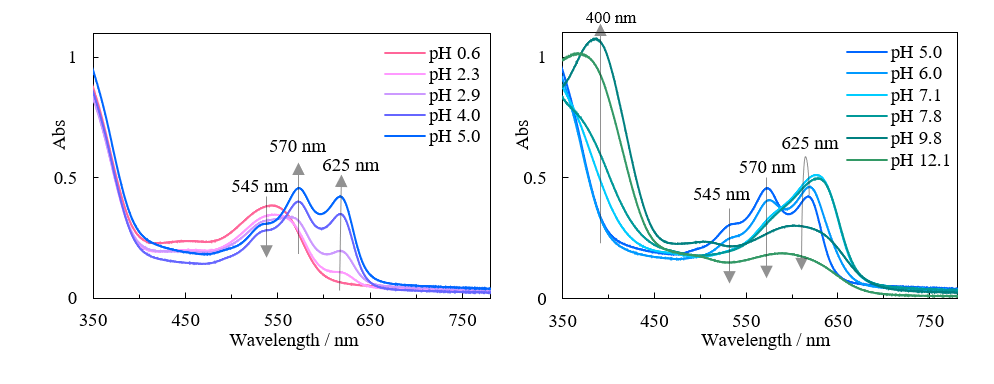
Fig. 3 pH dependence of absorption spectrum of butterfly pea extract
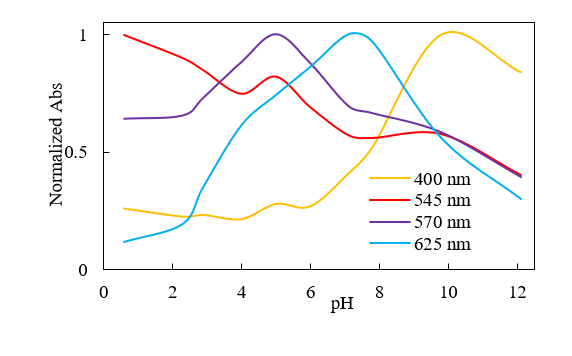
Fig. 4 pH Dependence of absorbance (normalized to maximum value) at different wavelengths for butterfly pea petal extract
The absorption band intensity at around 400 nm significantly increases at pH 6.0 and above, while that at 545 nm decreases with increasing pH. Additionally, the band intensity at 570 nm decreases at pH 5.0 and above, and that at 625 nm decreases at pH 7.1 and above. These trends cannot be easily identified without carefully comparing the spectra, and the effect of absorbance changes on the color of the solution is also difficult to assess.
Figure 5 shows the results of a color analysis performed using the JASCO color evaluation program.
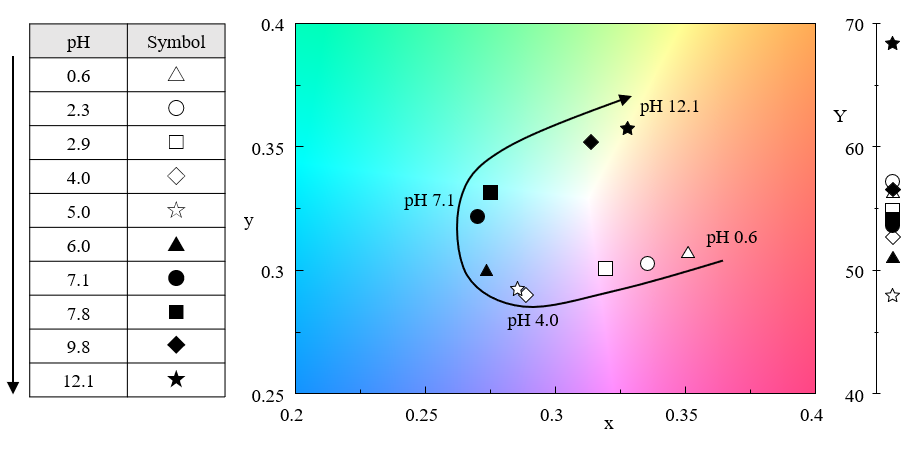
Fig. 5 pH Dependence of color for butterfly pea petal extract
Tracking the plot on the chromaticity diagram as the pH increases reveals that the direction of the color change shifts at around pH 4 and pH 7, where the absorbance at 570 and 625 nm, respectively, begins to decrease in Figure 4. Although the spectra for each pH exhibit complex changes, evaluation using a combination of chromaticity coordinates and color calculations allows the changes in the samples to be identified at a glance. The color evaluation program not only displays the measured spectra, but simultaneously shows color analysis results based on the specified color calculation conditions.
Conclusion
Our software effectively visualized the complex color changes of butterfly pea extract, which depend on pH. Describing these color variations in words is challenging due to their subjective nature. On the other hand, spectral analysis can sometimes be complex and requires specialized knowledge. However, plotting color coordinates on a chromaticity diagram allows an objective numerical representation of the coordinates while making color change trends instantly recognizable. Therefore, JASCO’s color evaluation program is ideal for assessing colorants and dyes that may exhibit intricate color variations.
Appendix – Conformational changes in ternatin due to pH
The relative intensity of different absorption bands for ternatin is dependent on the pH due to the coexistence of different molecular structures. Ternatin in butterfly pea flower extract has been reported to transition between four main structures depending on the pH, as shown in Figure 6.
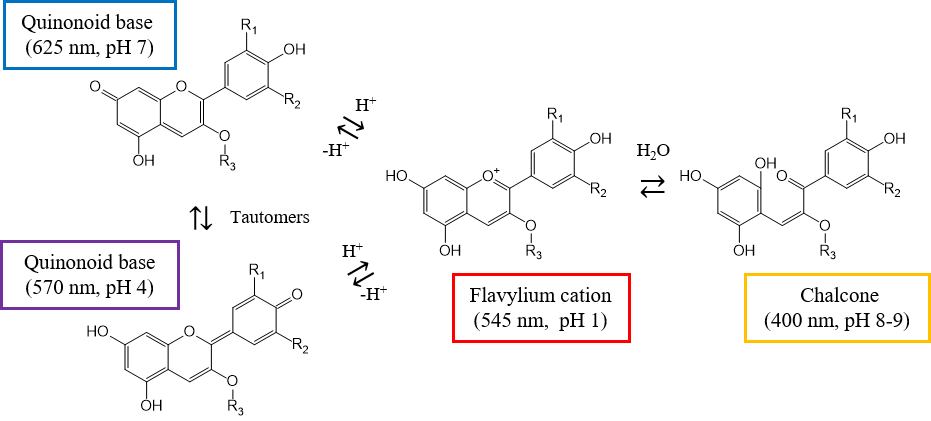
Fig. 6 Conformational change of ternatin
At around pH 1, it adopts the structure of a flavylium cation with absorption at 545 nm. As the pH increases, it shifts to two quinoid base structures, which are tautomers. At pH 4, the contribution of the structure that absorbs at 570 nm increases, and at pH 7, that of the structure that absorbs at 625 nm increases. As the pH increases from 8 to 9, the chalcone structure, which absorbs at about 400 nm, is formed.2,3) This relationship among pH, molecular structure, and absorption wavelength is in good agreement with the measurements in this report.
References
1.The Food and Drug Administration, 21 CFR Part 73.69, Listing Of Color Additives Exempt From Certification; Butterfly Pea Flower Extracts, 2021
2.N. Terahara, et al. Tetrahedron letters, 31(20), 2921-2924 (1990). DOI: 10.1016/0040-4039(90)80185-O
3.B. Wiyantoko, Indonesian Journal of Chemical Analysis (IJCA), 3, 22-32 (2020). DOI: 10.20885/ijca.vol3.iss1.art4
< Acknowledgements >
In preparing this report, we received invaluable support from Ms. Kei Okabe of Tokyo National College of Technology. I would like to take this opportunity to express my sincere gratitude.


