Introduction
Water is present on Earth in the form of gas (vapor), liquid (water), and solid (ice). Water is also a strongly polar solvent that can dissolve many inorganic and organic substances and cause chemical reactions. In living organisms, water dissolves proteins and nucleic acids and acts as a site for reactions essential for vital activities. The properties of water are greatly influenced by the hydrogen bonds formed between the hydrogen atoms of the OH group and the lone-pair electrons of nearby nitrogen, oxygen, and fluorine atoms. Since the oxygen atom in a water molecule has two lone electron pairs, hydrogen bonds with two hydrogen atoms can be formed, and water molecules can also form hydrogen bonds with each other.1)
The formation of hydrogen bonds changes the dipole moment of water molecules. Infrared spectroscopy can measure these changes with great sensitivity, and many measurements have been reported in the far-, mid-, and near-infrared regions.2-4) Furthermore, even in the visible region, where absorption due to molecular vibrations is generally not observed, infrared spectroscopy can detect vibrational overtones and combination bands arising from the molecular vibrations of water, which has strong fundamental vibrations. However, since the absorbance of water is very high in the mid-infrared region, transmission measurements require a cell with a short optical path length of about 10 µm, made of a material that transmits infrared light. On the other hand, from the visible to the near-infrared region around 1300 nm, transmission measurements can be performed with a typical cell made of quartz or glass that absorbs in the mid-infrared region, with an optical path length of 1 to 100 mm.
In this report, we present the results of temperature-dependent measurements of the absorption spectra of pure water in the near-infrared and visible regions, using a JASCO UV-Visible NIR spectrophotometer and a Peltier cell holder to investigate changes in hydrogen bonding.
Experimental
Sample
Ultrapure water degassed by ultrasonication and aspiration
System
Instrument: V-770 UV-Visible NIR spectrophotometer
Accessories: ETCS-761 Peltier thermostatted single position cell holder (water-cooled), CTU-100 Mini water circulation bath
Software: VWTS-958 Temperature interval scan measurement program
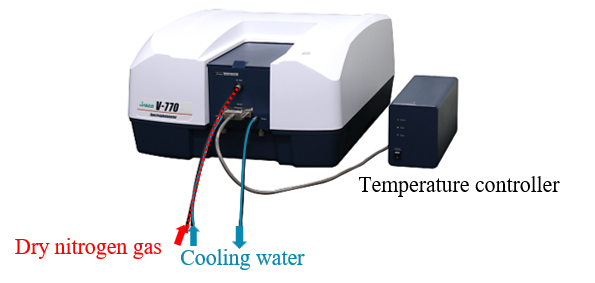
Fig. 1 Measurement system
Parameters
1) Near-infrared range
Measurement range: 900 nm -1300 nm
Data interval: 1 nm
Bandwidth: 4.0 nm
Response: 0.96 sec
Scan speed: 400 nm/min
Path length: 10 mm
2) Visible range
Measurement range: 700 nm – 850 nm
Data interval: 1 nm
Bandwidth: 1.0 nm
Response: 0.24 sec
Scan speed: 40 nm/min
Path length: 10 mm
Common parameters
Temperature range: 10 °C – 80 °C
Temperature interval: 5 °C
Ramp rate: 1 °C/min
Control sensor: Holder
Monitor sensor: Cell
To prevent condensation due to temperature changes, the measurements were conducted under a dry nitrogen atmosphere. The baseline was measured without a cuvette, in the blank state (nitrogen atmosphere).
Keywords
Water, near-infrared, hydrogen bond, overtone, combination band, temperature variation, Peltier cell holder, UV-Visible NIR spectrophotometer
Results
1. Near-infrared wavelength region
Absorption spectra of pure water in the near-infrared region at different temperatures are shown in Figure 2(A), and the difference spectra (relative to the spectrum at 10 °C) for each temperature are shown in Figure 2(B).
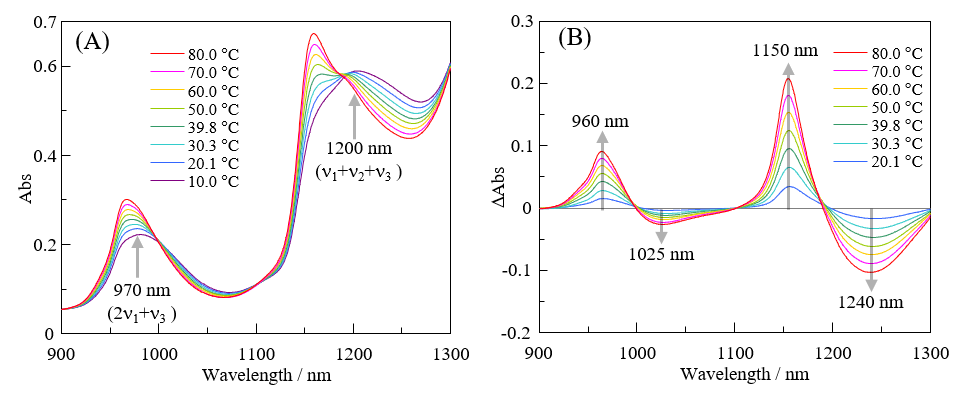
Fig. 2 (A) Temperature dependence of absorption spectrum of pure water from 900 nm to 1300 nm, (B) Difference spectra obtained by subtracting spectrum at 10 °C from spectrum at each temperature
Absorption by water molecules in the near-infrared region is due to overtones and combination bands associated with ν1 (symmetric stretching vibration), ν2 (scissoring vibration), and ν3 (asymmetric stretching vibration). The absorption observed at around 970 nm in Figure 2(A) is assigned to 2ν1+ ν3, and that at around 1200 nm to ν1+ ν2+ ν3.4) As shown in Figure 2(B), as the temperature increases, the absorbance at around 960 nm and 1150 nm increases, while that at around 1025 nm and 1240 nm decreases. Absorption at around 1150 nm is known to originate from water molecules (S0) whose OH-group hydrogen atoms are not hydrogen bonded, that at around 1200 nm from water molecules (S1) with one OH-group hydrogen atom that is hydrogen bonded, and that at around 1250 nm from water molecules (S2) with two OH-group hydrogen atoms that are hydrogen bonded.4) In other words, with increasing temperature, there is a significant increase in the relative contribution ratio of S0 and a significant decrease in that of S2 relative to S1. These results are consistent with the reported hydrogen-bonding contribution ratios of S0:S1:S2 = 0.27:0.42:0.31 at 6 °C and S0:S1:S2 = 0.40:0.42:0.18 at 72 °C.4)
The cuvette-derived absorbance was subtracted from that of the peak associated with S0 and that of the valley associated with S2. Then, the natural logarithm of the ratio of the absorbance of S0 to that of S2 was calculated. Figure 3 shows a plot with the y-axis representing this value and the x-axis representing the inverse of the absolute temperature.
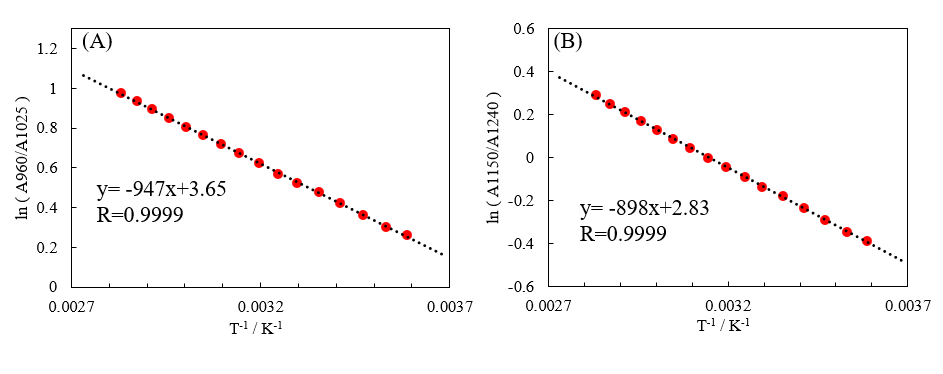
Fig. 3 Natural logarithm of ratios of absorbance of [water minus cuvette] against inverse of absolute temperature (K). A: 960 nm and 1025 nm, B: 1150 nm and 1240 nm
The hydrogen bonding states of water molecules are in equilibrium, as expressed by S2 ⇌ S1 ⇌ S0. The contribution of each state varies with temperature, and the natural logarithm of the equilibrium constant exhibits linearity with respect to inverse temperature.4) In this system, the equilibrium constant depends on the concentration ratio, so the peak ratio in the absorption spectrum correlates with the equilibrium constant. The use of an in-cell sensor allows precise measurement of the relationship between the temperature and the peak ratio, yielding good linearity in the graph. The absorption spectrum of water in the near-infrared region is sometimes used as an indirect method for measuring temperature, and its practicality has been validated.5)
2. Visible wavelength region
Absorption spectra of pure water in the visible region at different temperatures are shown in Figure 4(A), and difference spectra (relative to the spectrum at 11.9 °C) are shown in Figure 4(B).
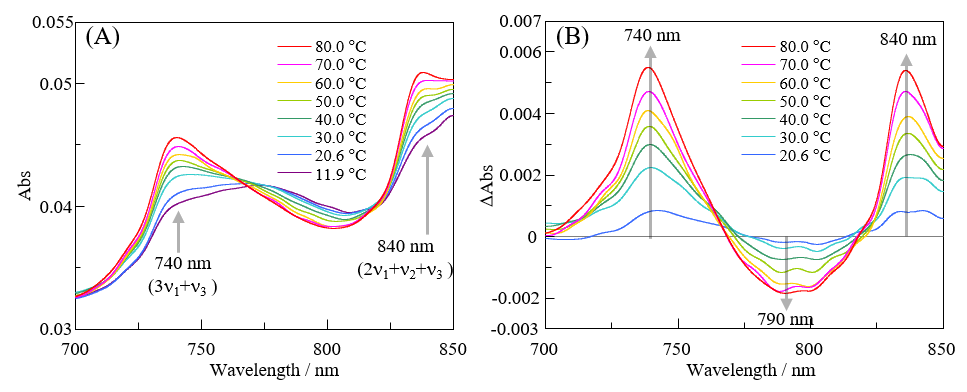
Fig. 4 (A) Temperature dependence of absorption spectrum of pure water from 700 nm to 850 nm, (B) Difference spectra obtained by subtracting spectrum at 11.9 °C from spectrum at each temperature (noise eliminated by FFT filtering)
In both figures, noise has been removed by FFT filtering. As in the case for the near-infrared spectra, the absorption at around 740 nm is thought to be associated with S0, and that at around 790 nm is thought to be associated with S2. Additionally, the absorption band at 740 nm is assigned to 3ν1+ ν3, and that at around 840 nm is assigned to 2ν1+ ν2+ ν3.4) The absorption band at 790 nm is based on 3ν1+ ν3.
The cuvette-derived absorption was subtracted from the absorbance for each band. Then, the natural logarithm of the ratio of the absorbance of S0 to that of S2 was calculated. As in Figure 3, Figure 5 shows a plot with the y-axis representing this value and the x-axis representing the inverse of the absolute temperature. The changes in the visible wavelength region are seen to be linear with respect to inverse temperature. This suggests that this change depends on the fraction of hydrogen bonds present.
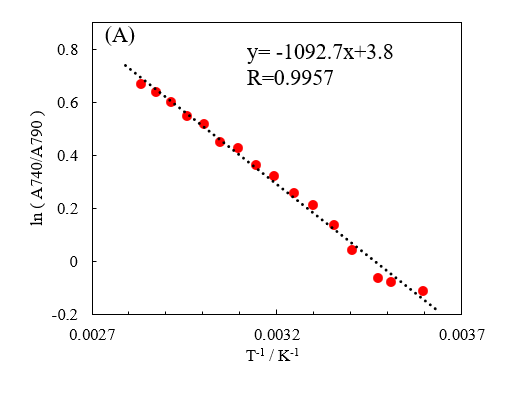
Fig. 5 Natural logarithm of ratio of absorbance at 740 nm and 790 nm for [water minus cuvette] against inverse of absolute temperature (K)
In a report by Ishikawa et al.,3) the peak height ratio in the far-infrared region was plotted against that in the mid-infrared region for the absorption derived from S0 and S2, clarifying the correlation between S0 and S2. Figure 6 shows a similar plot comparing the visible and near-infrared regions.
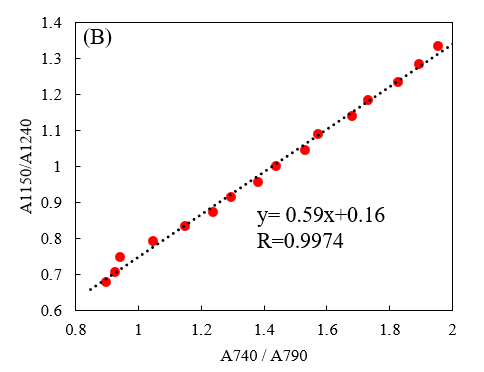
Fig. 6 Ratio of absorbance of [water minus cuvette] at 1150 and 1240 nm vs. that at 740 and 790 nm
Absorption in the near-infrared region is correlated with that in the visible region, indicating that the fraction of hydrogen bonds can be inferred from the measurement results in the visible region as well as those in the near-infrared region. The near-infrared region is affected by molecular vibrations associated with various organic compounds, making it difficult to observe changes in the hydrogen bonding state for samples other than pure water or inorganic salt solutions. On the other hand, there are many organic compounds that do not absorb at wavelengths in the visible region of 700 nm to 800 nm, and analysis of absorption in this region may be useful as a means of determining the hydrogen bonding state.
Conclusion
A temperature-dependent measurement system based on the JASCO UV-Visible NIR spectrophotometer was used to track the temperature dependence of the relative intensity of absorption bands in the near-infrared and visible regions due to changes in the fraction of hydrogen bonds in pure water. V-700 series Peltier cell holders are equipped with an in-cell sensor that allows accurate measurements of the temperature of a solution.a) A very strong temperature dependence of the absorption spectra in the near-infrared region was observed.
The absorption spectrum in the visible region also depends on the fraction of hydrogen bonds and by absorption in the near-infrared region, and may also be used to monitor changes in hydrogen bonding states with temperature. This is effective for solution samples whose near-infrared spectra are affected by dissolved components. The combination of a JASCO V-700 series spectrophotometer and a Peltier cell holder allows slight temperature-induced changes in absorption in the visible region to be detected for water, which is colorless and transparent to the naked eye.
References
1.D. Eisenberg, W. Kauzmann: The Structure and Properties of Water, Oxford University Press, USA (2005). DOI: 10.1093/acprof:oso/9780198570264.001.0001
2.T. Iwata, J. Koshoubu, C. Jin, Y. Okubo: Applied Spectroscopy, 51, 9 (1997). DOI: 10.1366/0003702971942196
3.D. Ishikawa, R. Shinohara, N. Shichishima, T. Fujii: Applied Spectroscopy, 77, 9 (2023). DOI: 10.1177/00037028231180869
4.K. Buijs, G. R. Choppin: The Journal of Chemical Physics, 39, 8 (1963). DOI: 10.1063/1.1734579
5.N. Kakuta, Y. Fukuhara, K. Kondo, H. Arimoto, Y. Yamada. Lab on a Chip, 11, 20 (2011). DOI: 10.1039/C1LC20261H
In preparing this report, I received valuable advice from Dr. Tomoyuki Fujii and Dr. Daitaro Ishikawa of Terahertz Optical and Food Engineering, Graduate School, Tohoku University. I would like to take this opportunity to express my sincere gratitude.


