Introduction
Two dimensional correlation spectroscopy was first proposed in the 1980s as an analytical method for investigating the changes in IR spectra with time. Although 2D correlation spectroscopy is typically used to analyze a single spectral type obtained from a time course measurement, in this experiment, two dimensional correlation spectroscopy was applied to time-course spectral data from two different spectroscopic measurements — IR and Raman. For this experiment an instant adhesive (cyanoacrylate) was used as the test material and spectral changes during the curing process were observed. Both the IR and Raman spectral data were analyzed using the 2D correlation program in Spectra Manager™.
FT/IR-4600 FTIR Spectrometer
Experimental
Commercially available instant adhesive was used as the sample. One of the main components, cyanoacrylate, reacts with water in the air resulting in polymerization; during this process it becomes hardened (Figure 1). IR spectra were measured by preparing a thin-film on a KBr window. IR spectra were measured using an FT/IR-4600 during a time course of 60 seconds at intervals of 2 seconds. Raman spectra were obtained using an NRS-5500 spectrometer. A drop of instant adhesive was thinly spread onto a glass slide, and was measured with a x20 objective lens during a 60 second time course at intervals of 2 seconds (with an excitation wavelength: 532 nm).
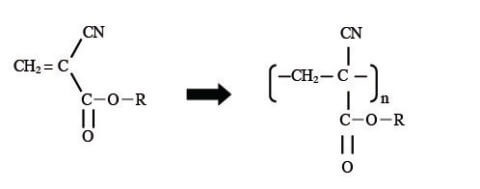
Figure 1. Reaction of instant adhesive curing process
Keywords
2D Correlation spectroscopy, cyano acrylate, polymerization reaction, NRS-4500, IRT-5000, FTIR, Raman, time course measurement
Results
The IR and Raman spectra obtained from the time course measurement are shown in Figure 2 and Figure 3 respectively.
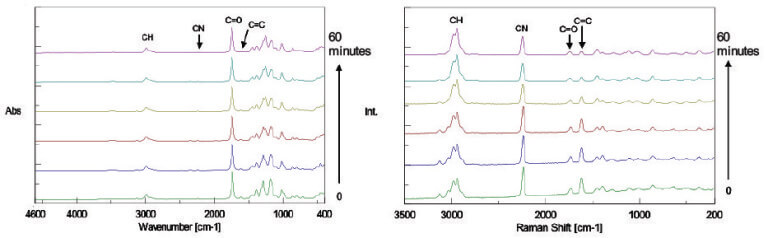
Figure 2. IR spectra (left), Figure 3. Raman spectra (right)
By comparing Figure 2 with Figure 3, it can be observed that the intensity of the Raman peak attributed to the C=C double bond at 1620 cm-1 decreases during the polymerization progress, while no clear change in the IR spectra can be seen with time because the peak intensity is too weak. Conversely, the peaks in the fingerprint region in the IR spectra change with time, while there is no distinguishable change in the peaks in the Raman spectra in the same region. The results of simultaneous correlation of the IR and Raman spectral changes with time are shown in Figs. 4 and 5 respectively.
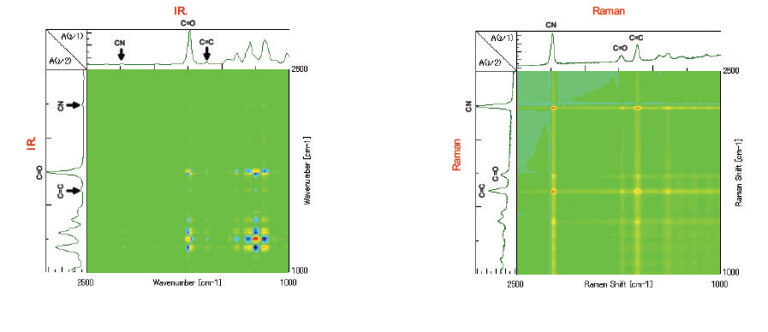 Figure 4. Simultaneous correlation spectrum with only IR (left), Figure 5. Simultaneous correlation spectrum with only Raman (right)
From the simultaneous correlation IR data shown in Figure 4, there is a correlation observed between the peaks from 1100 cm-1 to 1400 cm-1 in the fingerprint region and the C=O peak at 1735 cm-1, the significant difference of which is not seen in Figure 2. In the simultaneous correlation Raman data shown in Figure 5, there is a correlation seen between the C=C double bond peak at 1620 cm-1 and the C=O peak at 1735 cm-1. From this we can estimate that the peaks in the IR spectrum that largely change with time in the fingerprint region from 1400 cm-1 to 1100 cm-1, the C=C double bond peaks with strong activity in Raman and the C=O peaks may be correlated with each other.
In order to analyze the data in integrated manner, simultaneous correlation analysis was carried out by combining the IR spectra with Raman spectra (Figure 6). At the intersection point of the C=C peak in Raman with the C=O peak in the IR, the C=O peak at the low-wavenumber side in blue (minus) and the peak at the high-wavenumber side in red (plus) are correlated. It is considered that the C=O peak is shifted to the high-wavenumber side with time as the C=C peak is monotonically decreased with time as shown in Figure 7. In addition, the C=C peak in Raman and the IR peaks in the region from 1400 cm-1 to 1100 cm-1 also show correlation. As with the C=C in Raman against the C=O in the IR, a similar correlation is observed for the CN group, and accordingly, it is found that the peak intensity of CN group is deceased without peak shift.
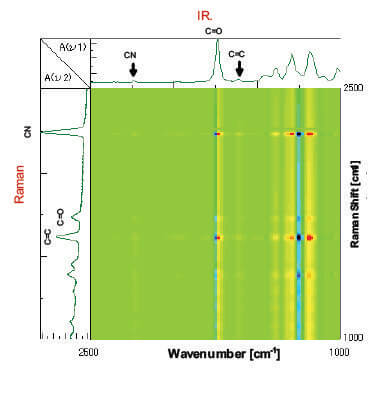 Figure 6. Simultaneous correlation spectrum with IR and Raman
As explained above, in accordance with the transformation of structure from C=C to C-C during the polymerization reaction, it is presumed that the conformation of the functional groups not related to the polymerization such as C=O and CN are also changed. In this example the results obtained by IR and Raman were used for analysis. However, a combination of results obtained from other spectroscopic techniques (NIR, UV, Visible, CD etc.) in addition to the results by Raman and IR would expand the possibilities for a variety of analysis, such as the attribution of peaks, lattice vibration and the relationship with color, chiral information and intramolecular vibration.
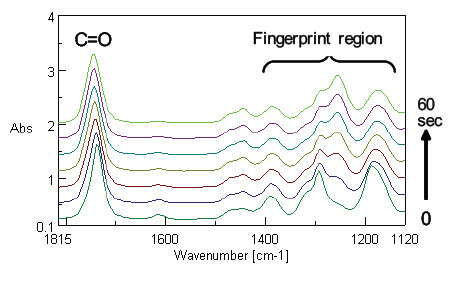 Figure 7. Expanded IR spectra
References
Noda, I – Generalized Two-Dimensional Correlation Method Applicable to Infrared, Raman, and other Types of Spectroscopy – Applied Spectroscopy Vol 47 Issue 9 1993
Noda, I – Two Dimensional Infrared Spectroscopy – J. Am. Chem. Soc., 1989, 111 (21), pp 8116–8118
About the Author
Mr. Akao, is the Applications Group Manager at JASCO Corporation, with many years at the company working on applications in electronic and vibrational spectroscopy, and is an expert in IR and Raman spectroscopy.
Related Posts:
 Two-dimensional Correlation Spectroscopy for…
 Fluorescence Observation and Foreign Materials…
 Quantitation of Glucose in Aqueous Solution using…
 Monitoring Microbial Fermentation using Raman Spectroscopy
 Reaction Monitoring System using Surface-Enhanced…
 Analysis of Carbon Products using Raman Spectroscopy