Introduction
Quantitative turbidity measurements is used to check the degree of clarity of potable and waste water. Turbidity describes the relative clarity of a sample due to particulates, microbes, and organic substances. The degree of turbidity can be measured from the amount of light scattered by the materials in the sample using a UV-Visible spectrophotometer in transmission mode or using an integrating sphere.
This article describes quantitative turbidity measurement using a UV-Visible spectrophotometer based on the clean water test method.
Experimental
Standard sample
An immiscible polystyrene suspension is used as the standard sample for the turbidity measurements. The mixture of 5 kinds of polystyrene-based particle in table 1 is defined as the undiluted solution of turbidity 100 degree, and can be purchased as the commercial product.
Table 1. Polystyrene-based particle of turbidity 100 degree
| No. | Nominal diameter [µm] | Mixture ratio [%] |
| No.6 | 0.5 | 6 |
| No.7 | 1 | 17 |
| No.8 | 2 | 36 |
| No.9 | 5 | 29 |
| No.10 | 10 | 12 |
Polystyrene turbidity standard solution(Turbidity: 100): KANTO CHEMICAL CO.,INC.
– Light transmission measurement method: 0, 0.1, 0.5, 1, 5, 10, 50, 75, 100 degree
– Integrating-sphere photoelectric photometry method: 0, 0.1, 0.5, 1, 5 degree
Light transmission measurement method
<Measurement method>
As shown in Figure 1, the intensity of direct transmitted light is decreased due to the scattering by the turbidity particle in the sample. Since its light decrease is proportional to the turbidity, turbidity can be determined. To create the calibration curve, absorbance of water sample at 660 nm are measured with use of pathlength 20, 50, or 100 mm cell.

Figure 1. Turbidity measurement (transmittance light measurement method)
<Measurement procedure>
(1) Prepare the standard sample. The blank sample is purified water filtrated by 0.2 µm membrane filter.
(2) Create turbidity calibration curve by using the above blank sample and standard sample.
(3) The water sample is put into the cell, and the absorbance measurement is carried out at 660 nm. By using the calibration curve (2), the turbidity of water sample can be calculated.
<Measurement parameter>
UV/Vis bandwidth: 2.0 nm
Response: 0.96 sec
To check the measurement repeatability, the measurement of turbidity 0 degree sample was carried out ten times after the blank measurement was carried out by ultrapurewater, and its result is shown in table 2. The values in the middle row are the absorbance, and the values in the right row are the turbidity calculated by using calibration curve.
Table 2. Measurement repeatability of turbidity 0 degree
| Measurement time | Abs | Turbidity |
| 1 | 0.00031 | 0.059 |
| 2 | 0.00030 | 0.057 |
| 3 | -0.00014 | -0.027 |
| 4 | 0.00003 | 0.005 |
| 5 | -0.00003 | -0.005 |
| 6 | -0.00009 | -0.017 |
| 7 | -0.00008 | -0.015 |
| 8 | 0.00004 | 0.007 |
| 9 | 0.00024 | 0.045 |
| 10 | 0.00001 | 0.002 |
| Ave | 0.00006 | 0.011 |
| SD | 0.00017 | 0.031 |
The absorbance of each sample was measured and the calibration curve is created. The absorbance and the calibration curve of each sample are shown in table 3 and figure 2.
Table 3. Turbidity and absorbance of each standard sample
| Turbidity | Abs |
| 0.1 | 0.0005 |
| 0.5 | 0.0027 |
| 1 | 0.0053 |
| 5 | 0.0259 |
| 10 | 0.0520 |
| 30 | 0.1599 |
| 50 | 0.2649 |
| 75 | 0.3949 |
| 100 | 0.5351 |
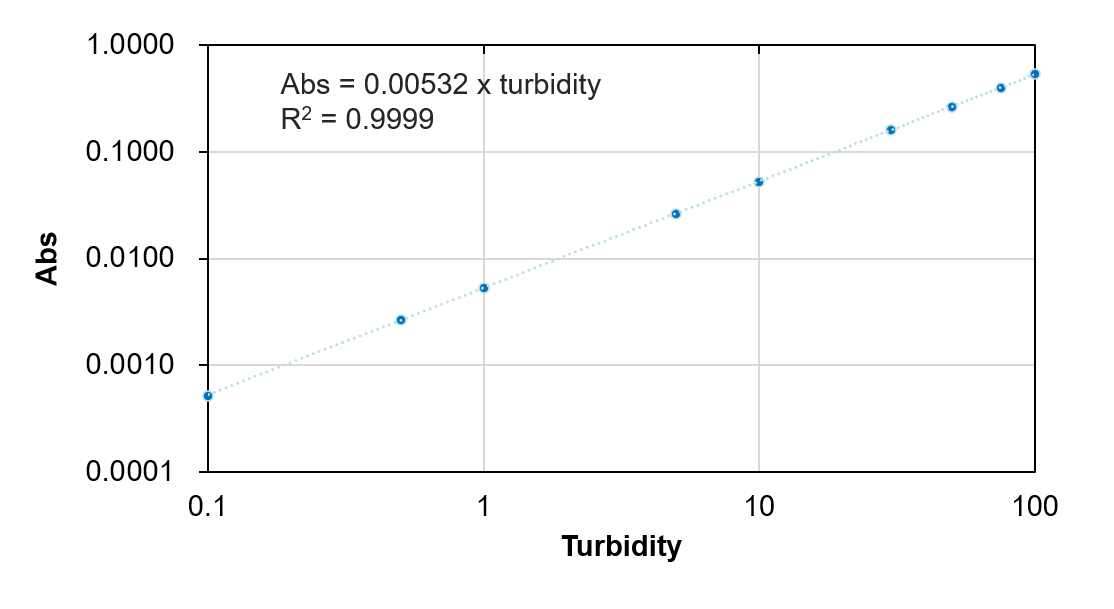
Figure 2. Turbidity calibration curve
The obtained calibration curve has high correlation, whose coefficient of determination (R2) is more than 0.999 within a range of 0.1 degree to 100 degree. The result of measurement repeatability with use of 20 mm pathlength cell indicates that the detection limit is 0.1 degree and determination limit is 0.3 degree*. These results suggest that the light transmission measurement method can be applied to the samples having a wide turbidity range.
*The calculation of detection limit is based on 3.3σ and the determination limit is based on 10σ.
σ: Standard deviation in turbidity 0 degree.
Integrating-sphere photoelectric photometry method
<Measurement method>
Since turbidity particle in sample scatters the light, the scattered light intensity (Td) and the transmitted light intensity (Tt : Td + direct light transmitted intensity) are measured by using the integrating sphere. Td/Tt ratio is proportional to the turbidity, and the turbidity can be determined. To create the calibration curve, transmitted intensity (Tt) and scattering intensity (Td) of water sample at 660 nm are measured with use of pathlength 10, 30, or 50 mm cell.
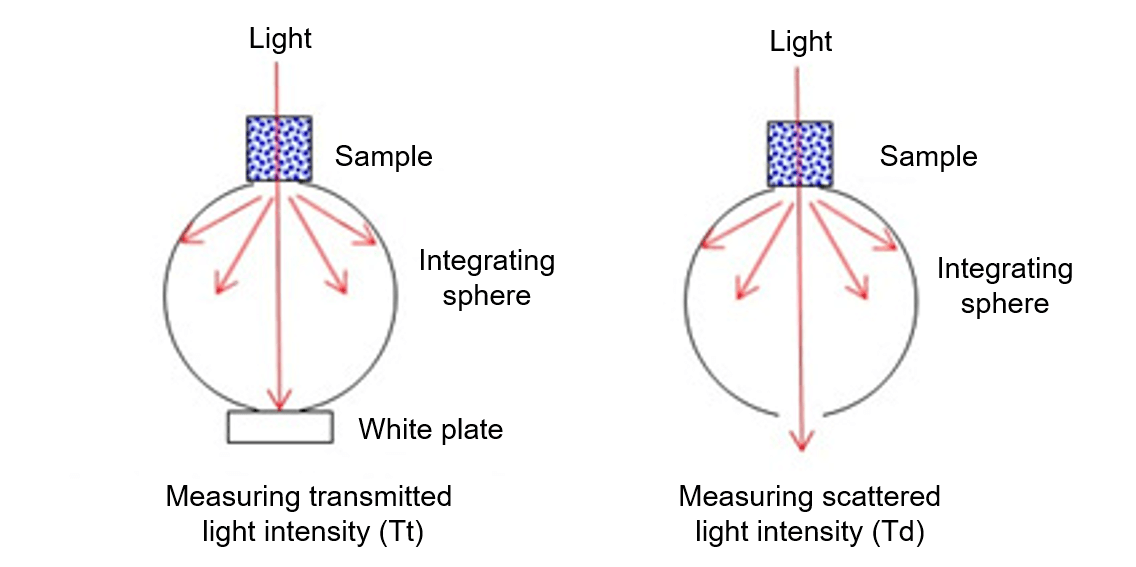
Figure 3. Turbidity measurement (integrating-sphere photoelectric photometry method)
<Measurement procedure>
(1) Prepare the standard sample. The blank sample is purified water filtrated by 0.2 µm membrane filter.
(2) Create turbidity calibration curve by using the above blank sample and standard sample. First, set the standard white plate to the integrating sphere and measure the transmitted intensity(Tt). Second, remove the standard white plate and measure the diffuse transmission intensity(Td).
(3) The water sample is put into the cell and the measurement of Td and Tt are carried out at 660 nm. By using the calibration curve, the turbidity of water sample can be calculated.
<Measurement parameter>
UV/Vis bandwidth: 5.0 nm
Response: 0.96 sec
To check the measurement repeatability of Td and Tt, the measurement of turbidity 0 degree sample was carried out ten times after the blank measurement was carried out by ultrapure water, and its result shown in table 4. The value in middle row are Td/Tt x 100, and the values in the right row are the turbidity calculated by using calibration curve.
Table 4. Measurement repeatability of turbidity 0 degree
| Measurement time | Td/Tt×100 | Turbidity |
| 1 | 0.00321 | 0.002 |
| 2 | -0.01877 | -0.011 |
| 3 | -0.00612 | -0.004 |
| 4 | -0.02076 | -0.012 |
| 5 | 0.05193 | 0.030 |
| 6 | 0.04435 | 0.026 |
| 7 | 0.03930 | 0.023 |
| 8 | 0.04202 | 0.024 |
| 9 | 0.02417 | 0.014 |
| 10 | 0.03256 | 0.019 |
| Ave | 0.01919 | 0.011 |
| SD | 0.02742 | 0.016 |
The Tt and Td of each sample were measured and the calibration curve was created. The Td/Tt x 100 and the calibration curve of each sample are shown in table 5 and figure 4.
Table 5. Turbidity and absorbance of each standard sample
| Turbidity | Td/Tt×100 |
| 0.1 | 0.24131 |
| 0.5 | 0.99534 |
| 1 | 1.89208 |
| 5 | 8.62411 |
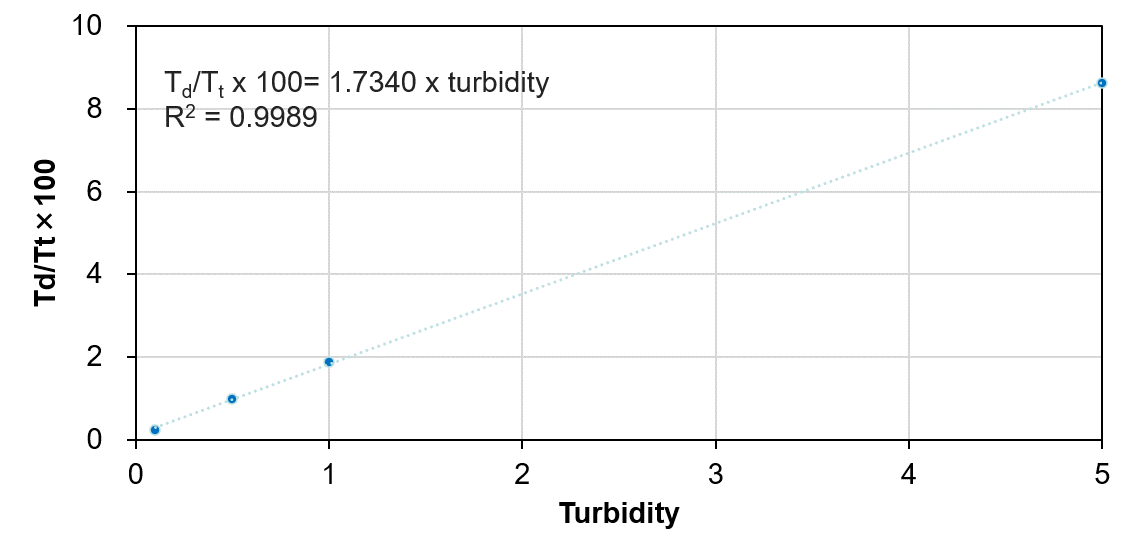
Figure 4. Turbidity calibration curve
The obtained calibration curve has high correlation, whose coefficient of determination (R2) is more than 0.9989 within a range of 0.1 degree to 5 degree. The result of measurement repeatability with use of 50 mm pathlength cell indicates that the detection limit is 0.06 degree and determination limit is 0.2 degree*. Compared to light transmission measurement method, the turbidity measurement of integrating-sphere photoelectric photometry method is more effective to the coloring sample since calculating the transmittance ratio can cancel the intensity decrease by absorption of sample itself.
*The calculation of detection limit is based on 3.3σ and the determination limit is based on 10σ.
σ: Standard deviation in chromaticity 0 degree.
Keywords
Turbidity, Water Test Methods, detection limit, determination limit
Conclusion
JASCO can provide optional accessories and programs applying to the light transmission measurement method and the integrating sphere photoelectric photometry method in Water Test Method. In addition, these accessories and programs can also be applied to the following examinations.
– The light transmission measurement method and the integrating sphere photoelectric photometry method by using kaolin or formazin (JIS K 0101)
– The light transmission measurement method by using formazin (JIS K 0400-9-10)
– The light transmission measurement method (ISO 7027)
– The light transmission measurement method (ASTM D 7315)
– Chromaticity measurement (Water Test Method, ISO 7887)


