Introduction
When measuring the sample with high refractive index by ATR method, its spectrum may be distorted. This article explains the data processing (ATR correction) to improve the distorted ATR spectrum so that ATR spectrum may be well consistent with the transmittance spectrum.
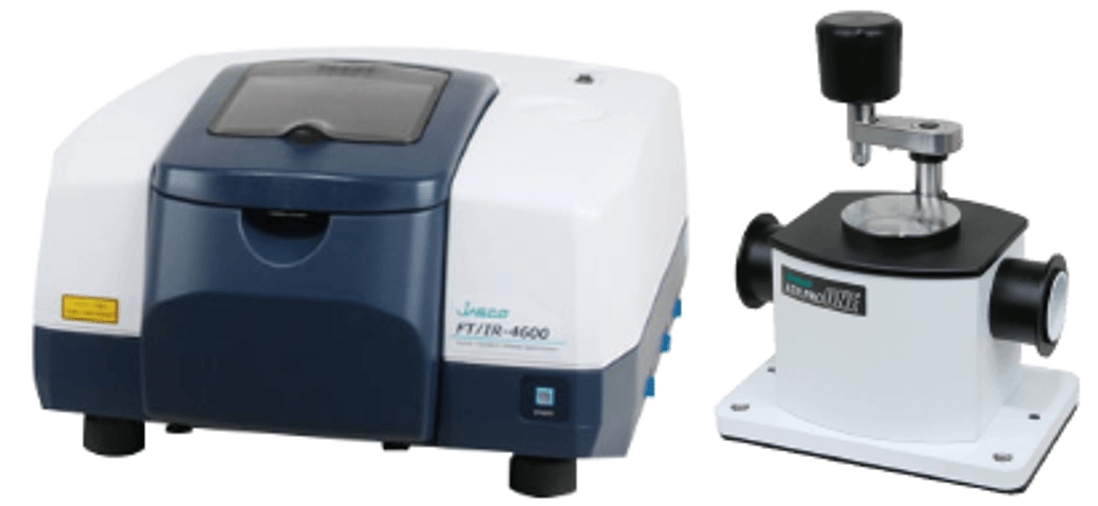
FTIR spectrometer with ATR accessory
Features of ATR method
The ATR method doesn’t require any special sample preparation enabling very easy measure. That is why this method has been used widely in recent years. However, ATR method has the following drawbacks.
(1) Penetration depth of light to the sample depends on the wavenumber.
(2) Absorption peak may be distorted and shifted to the low wavenumber side as compared with the transmission method.
As a result, the shape of obtained spectrum is different from that of transmittance spectrum as shown in Figure 1. The shift of the peak to the lower wavenumber side causes the following problems: it makes the assignment difficult, causing the wrong result when measured ATR spectrum is applied to Spectra Search by using the library containing transmittance spectra.
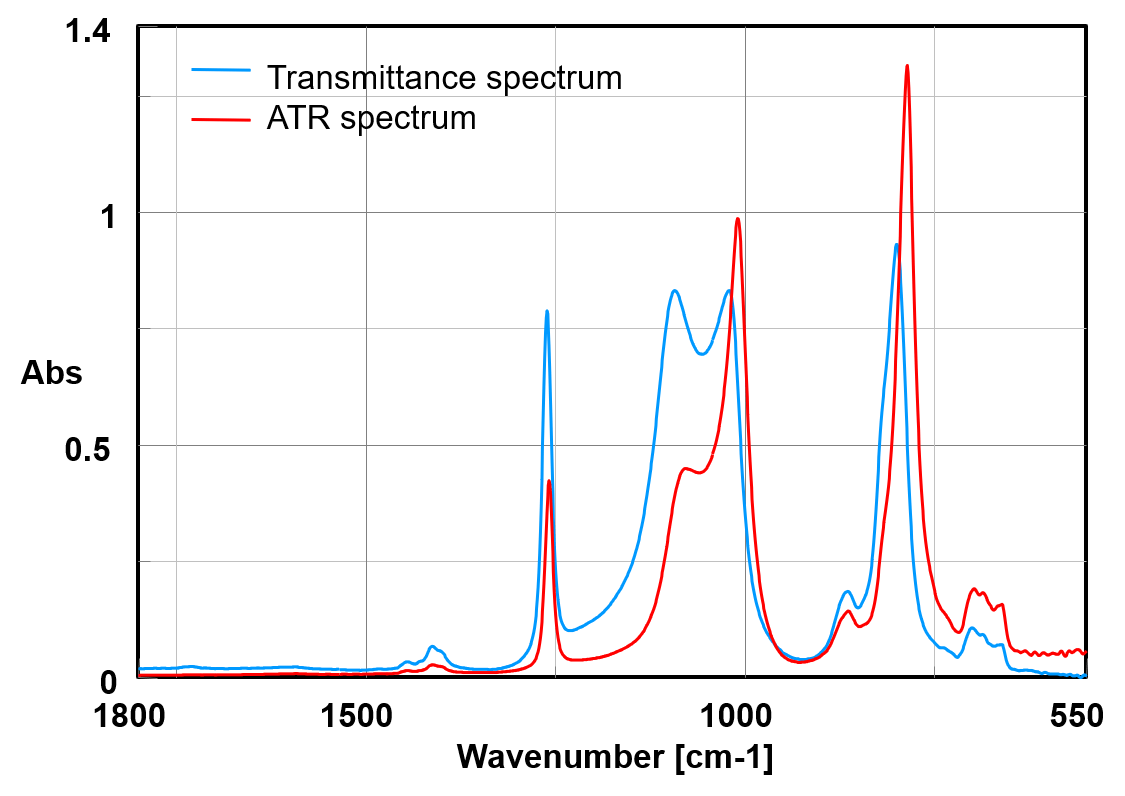
Figure 1. Transmittance spectrum and ATR spectrum of silicon grease
As mentioned above, the improvement of analysis accuracy is expected by utilizing the corrected ATR spectrum.
ATR Correction
The correction of ATR spectrum has performed before, but the correction has been applied only for (1), but not for (2) as shown in Figure 2.
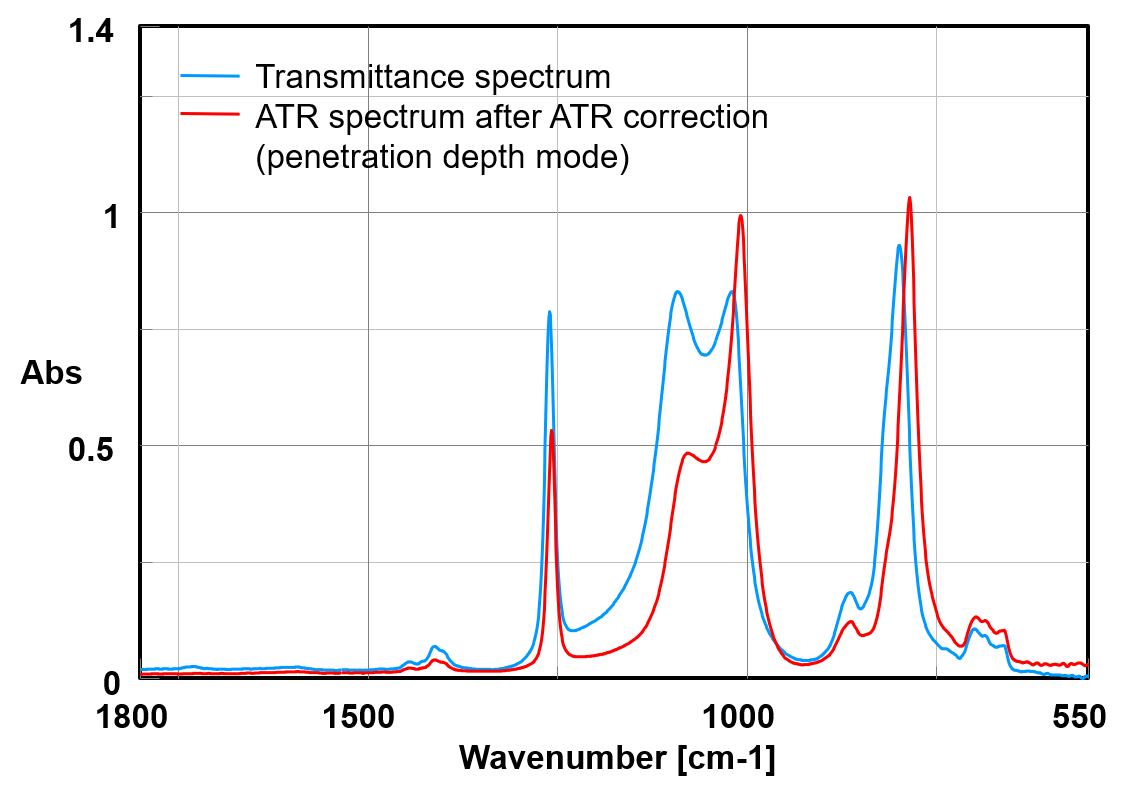
Figure 2. Transmittance spectrum and ATR spectrum after ATR correction (penetration depth mode) of silicon grease
The refractive index of the sample depends on the wavenumber and especially, it shows the large value due to anomalous dispersion in the vicinity of wavenumber of absorption. If the sample has a high refractive index, the total reflection would not happen, resulting the wavenumber shift to the lower side.
ATR correction of JASCO corrects both (1) and (2) by considering anomalous dispersion. Figure 3 shows the ATR spectrum after ATR correction in which the wavenumber shift was corrected, and as a result, the same spectrum as transmittance spectrum was obtained.
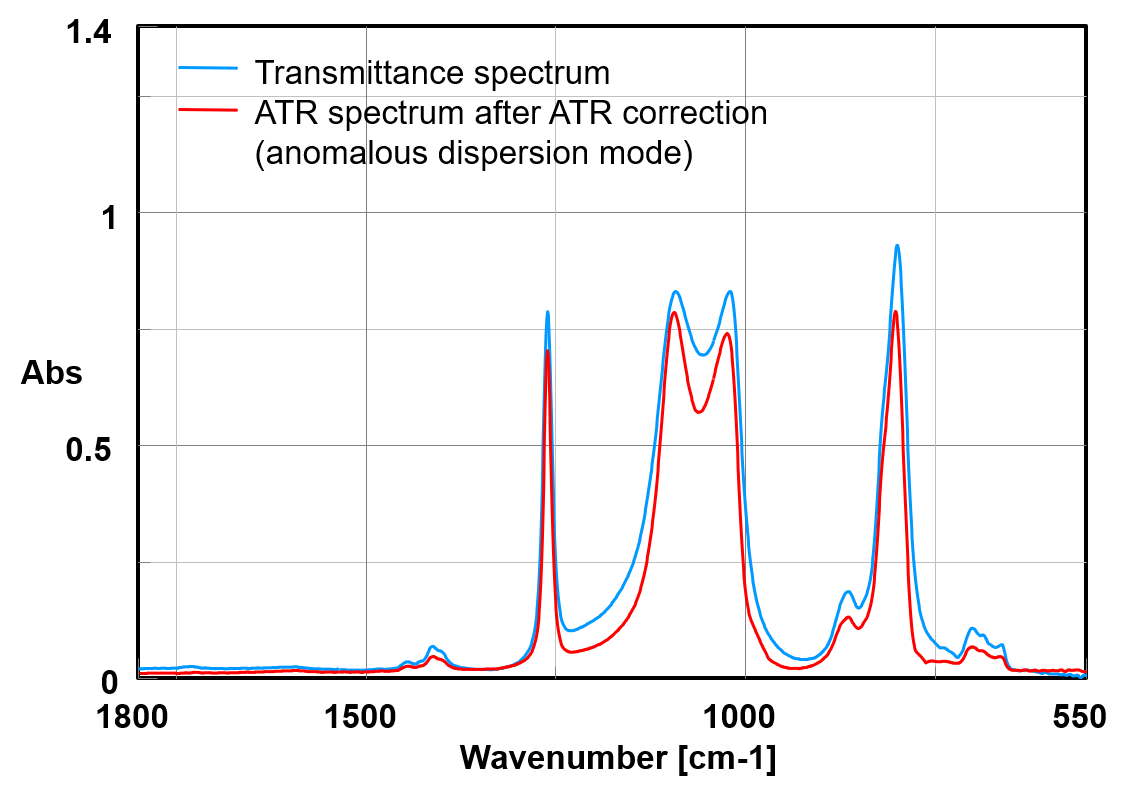
Figure 3. Transmittance spectrum and ATR spectrum after ATR correction (anomalous dispersion mode) of silicon grease
Database search
We have implemented Spectra Search for each “Transmittance spectrum (TRA)”, “ATR spectrum (ATR)”, “ATR spectrum after ATR correction (penetration depth mode) (PD)”, and “ATR spectrum after ATR correction (anomalous dispersion mode) (AD). The result is shown in Table 1.
Table 1 Search result of the database
| TRA | ATR | PD | AD | |
| HQI* | 925.80 | 708.56 | 750.17 | 916.48 |
| * It means the value is larger, degree of coincidence is higher. | ||||
It is confirmed that the result incorporating the anomalous dispersion shows the very effective correction and the search result is much closer to transmittance spectrum as compared with the result obtained by the penetration depth mode.
As shown above, ATR spectrum correction incorporating the anomalous dispersion is very effective.


