Introduction
Nuclear magnetic resonance (NMR), X-ray diffraction (XRD), electronic circular dichroism (ECD), vibration circular dichroism (VCD) and tandem Mass spectrometry (MS/MS) are often used to analyze the structure of enantiomers of chiral compounds – typically 1 to 100 mg of sample is required for these analyses.
The methods for producing enantiomers can be roughly classified into asymmetric synthesis, crystallization, enzyme reaction, and optical resolution by chromatography. Preparative purification using chromatography with a chiral column has been proven to be highly cost-effective and is used in a variety of fields such as pharmaceuticals, agricultural chemicals, natural products, biomolecules, and functional materials. In recent years, supercritical fluid chromatography (SFC), which offers a faster and more efficient separation than HPLC, has been gaining ground as an efficient method for isolating pure enantiomers. Since carbon dioxide (CO2), the main solvent for SFC vaporizes at room temperature and atmospheric pressure, it offers the key advantage that the mobile phase can be easily removed from the sample during fractionation, good from an environmental perspective.
In this article, a semi-preparative SFC system was used to separate and fractionate racemic flavanone into its individual enantiomers and both a J-1500 (ECD) and FVS-6000 (VCD) were also used to analyze these fractions. A comparison was made between the theoretical spectra obtained by computational chemistry with the measured spectra to determine the absolute configuration of each enantiomer.
Experimental
[Conditions of SFC]
Column: CHIRALPAK IA/SFC (20 mm I.D. x 250 mm L, 5 µm)
Modifier solvent: Methanol
Flow rate: CO2; 35 mL/min, Methanol; 10 mL/min
Column temp.: 40 ºC
Wavelength: 310 nm
Back pressure: 20 MPa
Injection volume: 1 mL
Sample solution: 10 mg/mL racemic flavanone in methanol
[Structure]

Flavanone
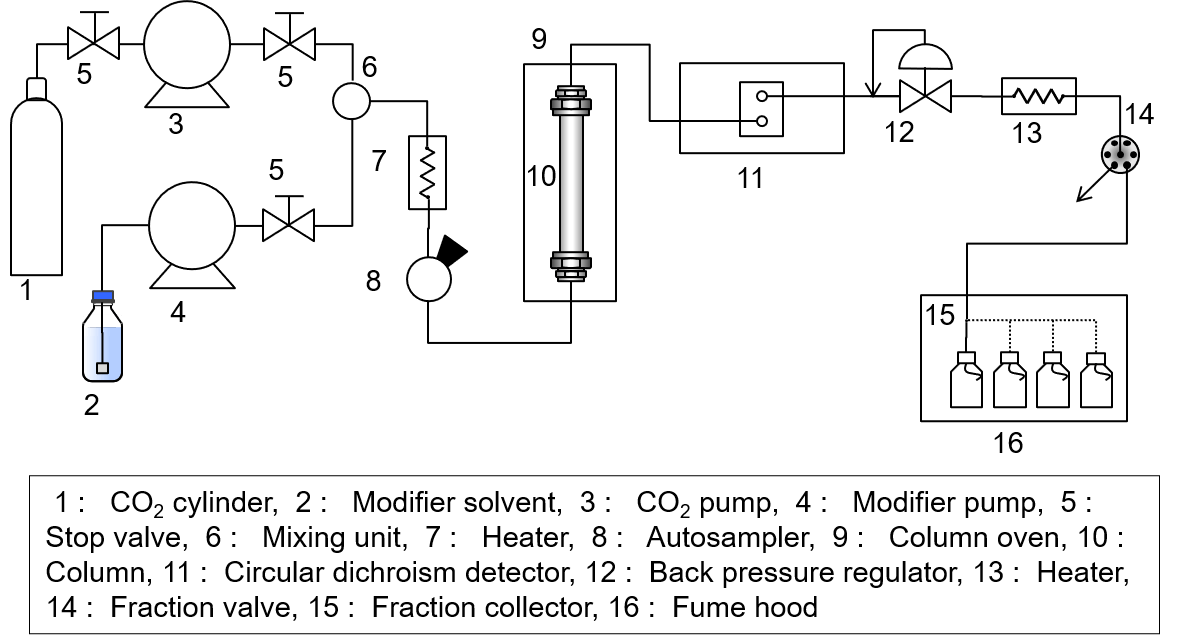
[Schematic diagram of SFC]
Keywords
chiral separation, preparative, enantiomer, Flavanone, SFC, CD, structural analysis, computational chemistry
Results
Repeated fractionation using stacked injections was performed in order to obtain fractions of 100-200 mg of each enantiomer in a short time. A total of 40 injections were made at 3.5 min intervals and each peak was fractionated into separate collection vials. Figure 1 shows the flavanone fractionation from the first injection.
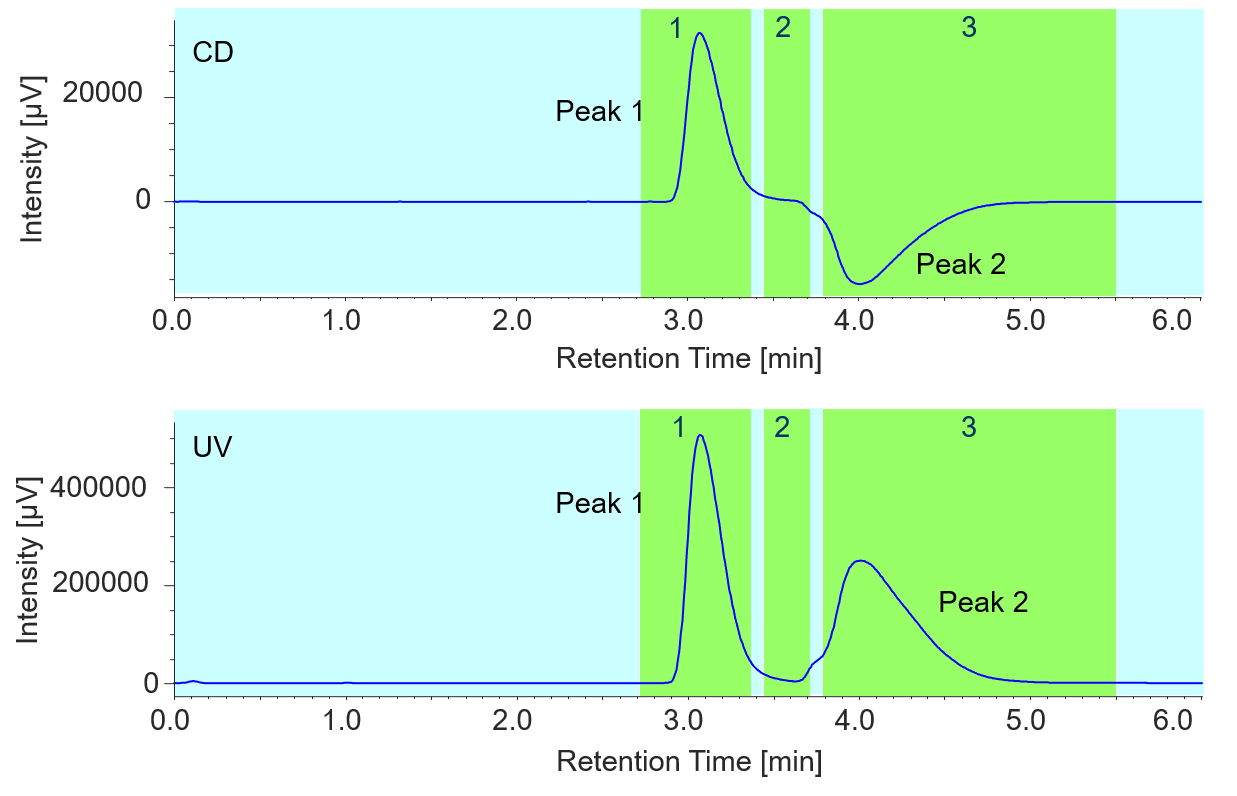
Figure 1. Flavanone fractionation of the first injection (The number shown in the chromatogram is the collection vial number)
To improve the purity of each peak, an additional collection vial was used between the two peaks. Figure 2 shows a chromatogram for stacked injections 1 to 20.
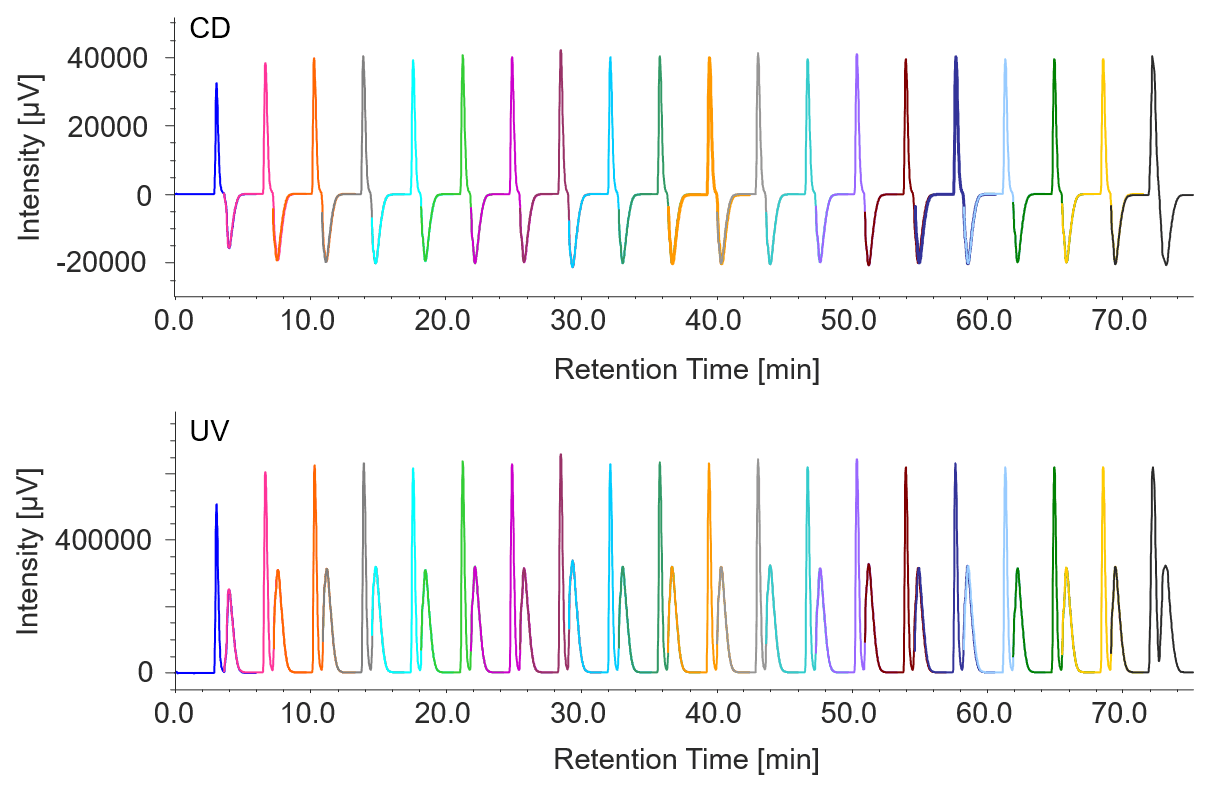
Figure 2 Chromatogram of flavanone by stacked injection (injections 1 to 20)
Recovery was measured at 184 mg for peak 1 (92% recovery rate) and 149 mg for peak 2 (74% recovery rate). Using conventional injection mode, the total process time is estimated at 4 hours, but with stacked injections, it was reduced to only 2.4 hours and 40% reduction in solvent consumption.
Fractions of the flavanone enantiomer peaks collected by SFC were pretreated according to the procedure shown in Figure 3 for spectroscopic analysis using ECD and VCD.

Figure 3. Pretreatment procedure for each enantiomer for ECD and VCD measurement
Figure 4A shows the ECD and UV spectra of flavanone. Figure 4B shows the theoretical spectrum calculated by Gaussian 16 (computational chemistry software).
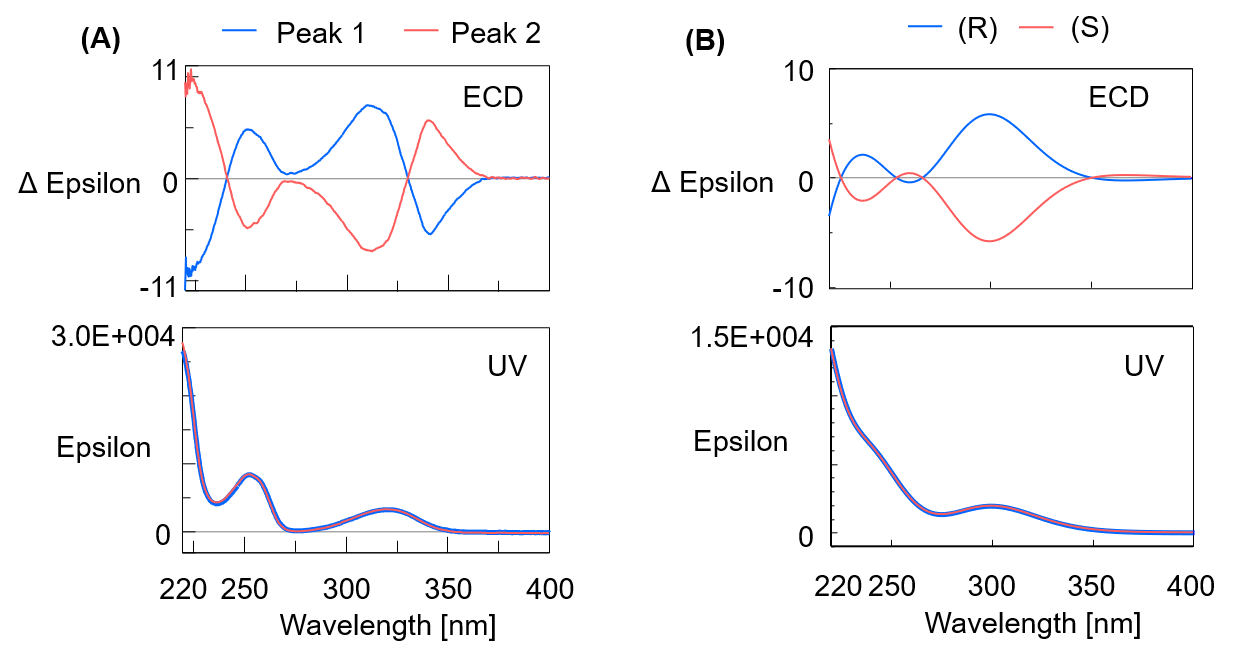
Figure 4. ECD and UV spectra of Flavanone (A: Actual measured spectra, B: Theoretical spectra, Calculation method for theoretical result: TD-DFT calculation: B3PW91/CC-pVTZ level)
Comparing the measured and theoretical spectra, the polarities of the ECD spectra around the maximum peak wavelength were the same, so it was possible to identify peak 1 as the R- form and peak 2 as the S- form.
Figure 5A shows the VCD and IR spectra of flavanone measured by VCD, and Figure 5B shows the calculated theoretical spectra.
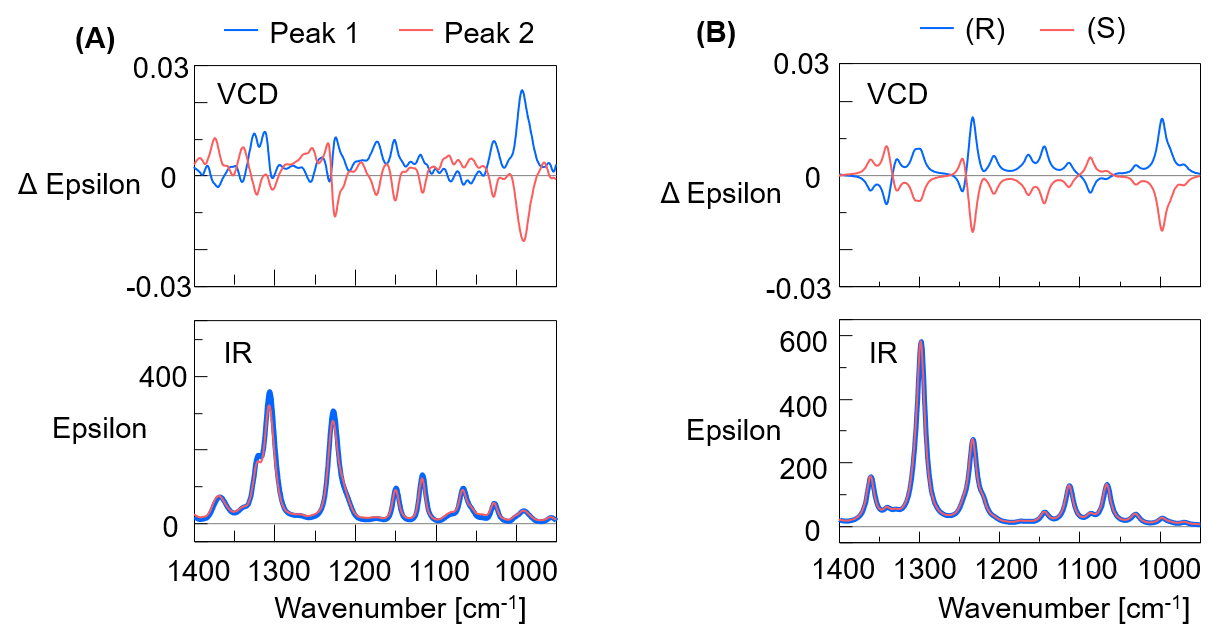
Figure 5. VCD and IR spectra of Flavanone (A: Actual measurement result, B: Theoretical result, Calculation method for theoretical result: DFT calculation: B3PW91/CC-pVTZ level)
By comparing the measured and theoretical spectra, from the matching polarities peak 1 was confirmed as the R- configuration and peak 2 as the S- configuration, same as the ECD measurement results. Figure 6 shows the absolute molecular configurations of flavanone R- and S- enantiomers obtained by calculation.
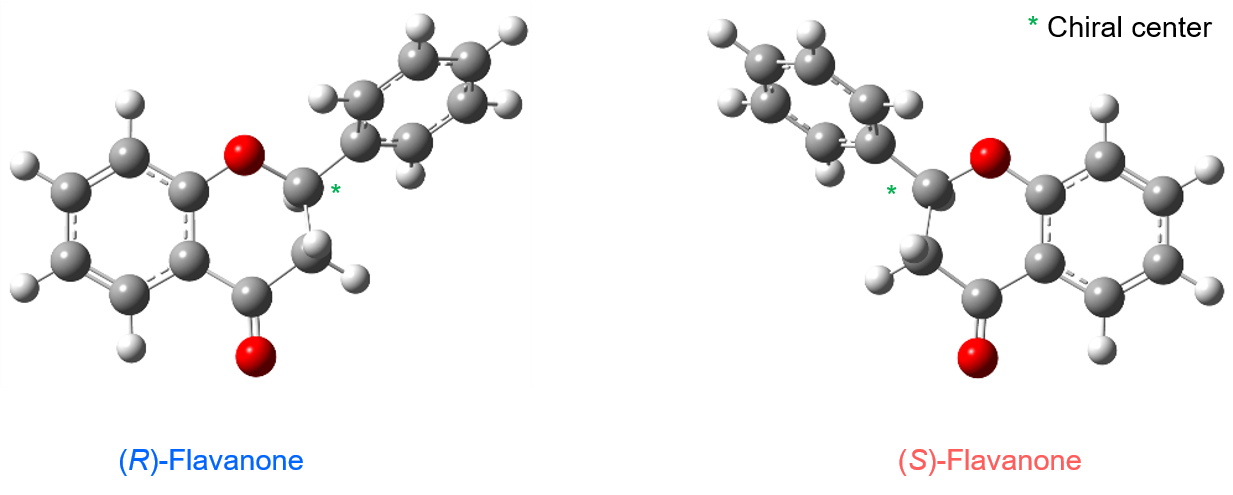
Figure 6 Absolute configuration of flavanone obtained by calculation
Related Posts:
") Chiral preparative separation of warfarin using…
Chiral preparative separation of warfarin using… Analysis of Flavanone by SFC-PDA-CD Method Scouting…
 Increased Productivity of Chiral Separation in…
") Achiral preparative separation using Preparative SFC…
Achiral preparative separation using Preparative SFC… Rapid Column Screening for Chiral Separation by Parallel SFC
 Structural Analysis of Chiral Samples with Multiple…