Introduction
Biopharmaceuticals have high specificity to diseased parts and have few side effects on the effect, and in recent years their market size is expanding more and more. On the other hand, compared with conventional low molecular weight medicines, its structure is affected easily by temperature, solvent, pH, etc., and its function may be lost due to changes in manufacturing process etc. Therefore, it is very important to evaluate its stability and confirm its equivalence in the development and quality control of biopharmaceuticals.
Since the CD spectrum reflects the structure of proteins and nucleic acids and changes its shape, it is widely used for structural analysis and stability evaluation of these biopolymers. In recent years, using these features, the CD measurement method is used for development of biopharmaceuticals and comparison of equivalence between original drugs and biosimilars.
Here we introduce [Spectrum QC Test] program developed to apply the CD measurement method to confirm the equivalence of biopharmaceuticals. By using the statistical method, the [Spectrum QC Test] program can quantitatively determine whether the change in the CD spectrum is due to the noise of the equipment or the structural change of the protein. In this article, the structural change caused by thermal denaturation of human serum albumin was evaluated.
J-1500 CD spectrometer
Experimental
First, 10 CD spectra (1 mm optical path length, 0.1 mg/mL of concentration) of human serum albumin aqueous solution at 20ºC were measured in order to obtain the average and deviation of reference spectrum group. Next, under the same condition as reference spectra, the CD spectra of human serum albumin aqueous solution were measured every 10ºC from 20ºC to 90ºC, and the equality of CD spectra and reference spectral group at each temperature was judged by [Spectrum QC test] program.
Measurement Condition
Scan speed: 100 nm/min.
Response: 1 sec.
Data acquisition interval: 0.1 nm
Spectral bandwidth: 1 nm
Accumulation: 1 time
[Spectrum QC Test] program
- Quantitative evaluation is possible by judgment using statistical method (z test)
- Correlation coefficient, Euclidean distance, Manhattan distance are installed as comparison algorithm
- 21 CFR Part 11 compliant
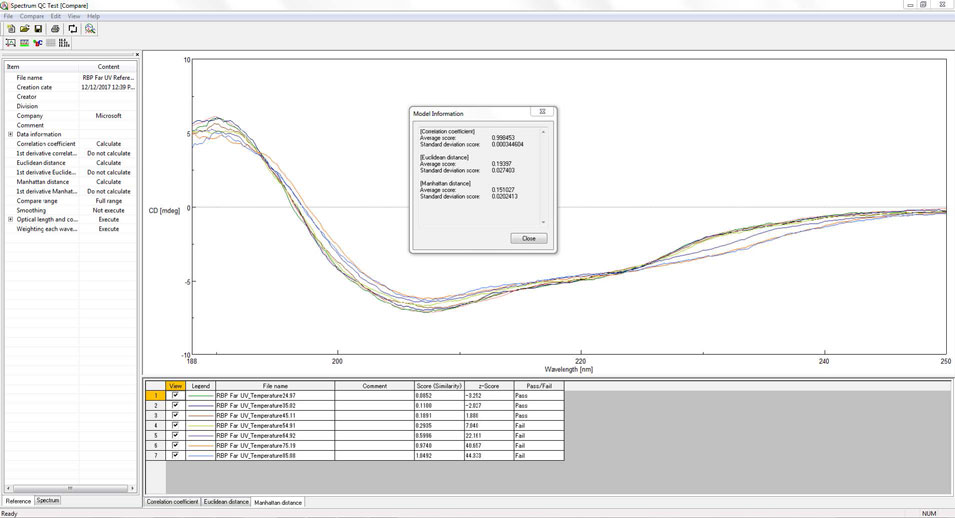
Figure 1. [Spectrum QC Test] program
Keywords
Biopharmaceuticals, quality control, biochemistry, circular dichroism measurement
Results
Figure 2 shows the measurement result of 10 reference spectra measured at 20ºC, and figure 3 shows the change in CD spectra of human serum albumin aqueous solution with temperature rise. As the temperature rises, the intensity of CD spectrum decreases and the negative peak at 222 nm derived from the α-helix structure becomes unclear.
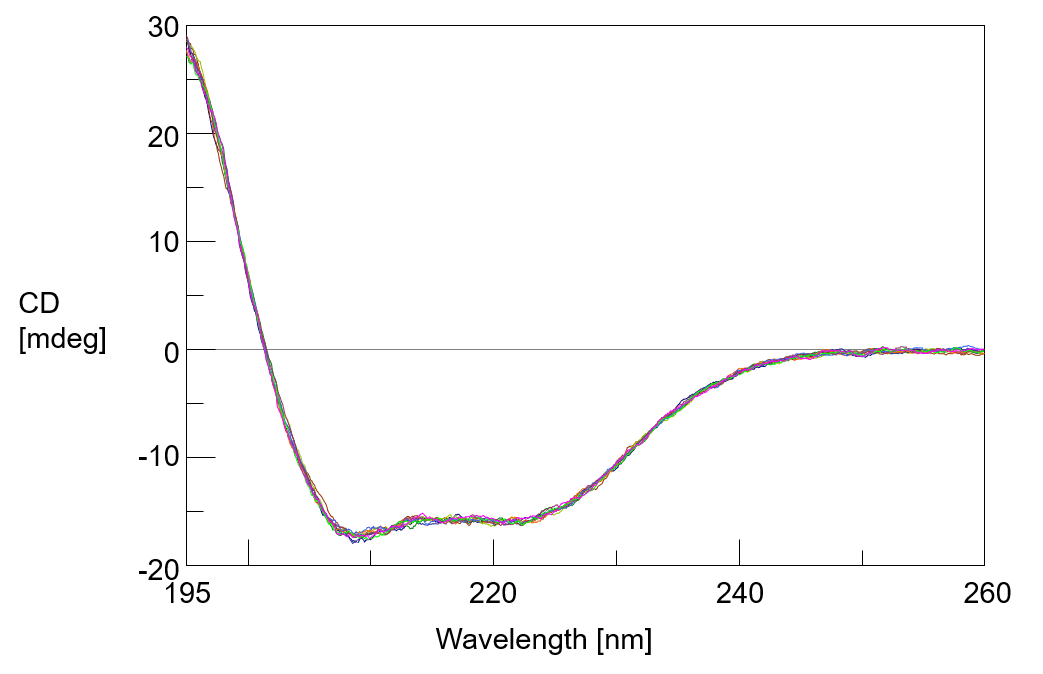
Figure 2. Reference CD spectra of human serum albumin aqueous solution (20ºC)
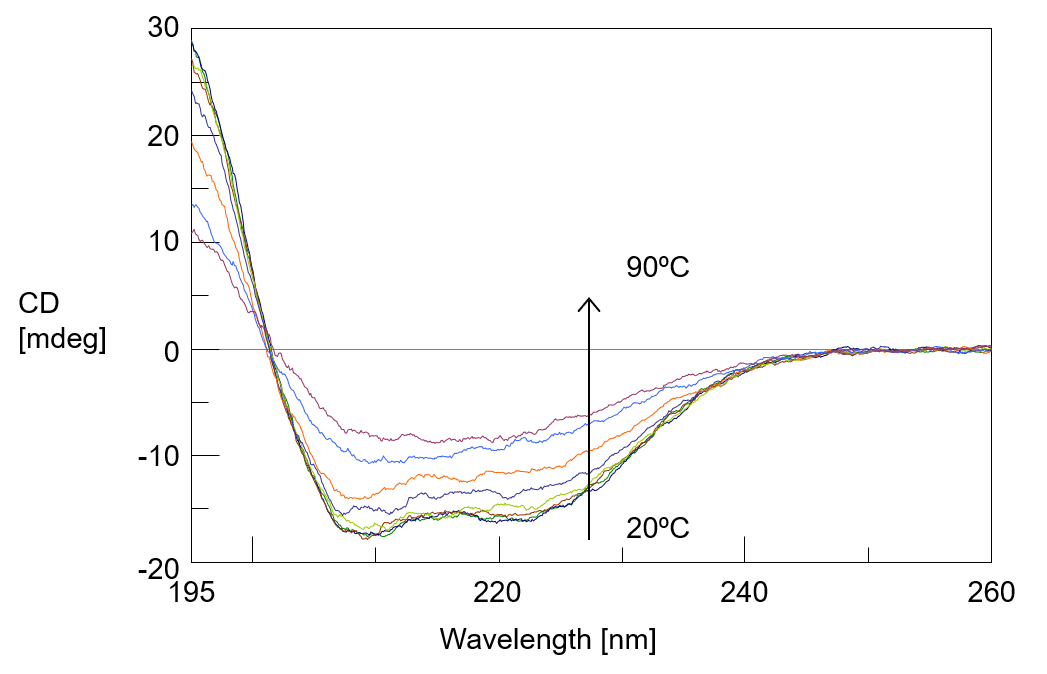
Figure 3. CD spectra monitoring (at 20ºC to 90ºC)
Analysis
By using the [Spectrum QC test] program, the similarity of the CD spectrum at each temperature was calculated from the Euclidean distance to the reference data group of human serum albumin aqueous solution at 20ºC, and the equivalence to the reference spectrum group was judged by z test.
Table 1 Results of Spectrum QC test
| Temperature | Score( similarity) | Z score | Pass/Fail |
| 20ºC | 0.2445 | 0.2504 | Pass |
| 30ºC | 0.2996 | 1.7447 | Pass |
| 40ºC | 0.3653 | 3.5243 | Fail |
| 50ºC | 0.5415 | 8.3030 | Fail |
| 60ºC | 1.5363 | 35.2716 | Fail |
| 70ºC | 3.0215 | 75.5351 | Fail |
| 80ºC | 5.0975 | 131.8180 | Fail |
| 90ºC | 6.2001 | 161.7110 | Fail |
Condition of spectrum comparison
Algorithm: Euclidean distance
Comparison range: 195-260 nm
Z score criteria: 2 or less
From these results, it was found that the CD spectra of 20ºC and 30ºC measured under the same conditions as the reference spectrum group were judged to have the same spectral shape with respect to the reference spectral group, whereas at the temperature of 40ºC or higher The CD spectrum was not judged to be equivalent.
In this way, by using the [Spectrum QC test] program, it is possible to quantitatively judge the equivalence of spectra in a statistical method, and to objectively judge structural changes in proteins.


 spectrometer")


