Introduction
Near IR light is widely used for non-destructive analysis as an evaluation method in food and pharmaceutical industry due to it’s characteristics such as transmitting the glass container and weaker peak absorbance than Mid-IR light. Recently, this NIR analysis technique is introduced to the Process Analytical Technology which has been proposed by FDA, and it is used for evaluation of uniformity of mixed samples inside of vials, evaluation of water content by in-line measurement, and evaluation of contents in tablet by using of NIR microscope. There are are various analysis methods using NIR spectroscopy such as dispersive type, filter type and AOTF type, while FTIR is considered to be better method due to several advantages such as wavenumber expandability, high throughput and high accuracy of wavenumber. JASCO IR Microscope system IRT-5000/7000 has a unique feature as option which is detachable detector unit, which makes it possible to extend the measurement range up to NIR in one single FTIR system. This time, we analyzed the distribution of components on tablet surface by NIR imaging system which consists of FT/IR-6700 and IRT-7200 with NIR expansion.
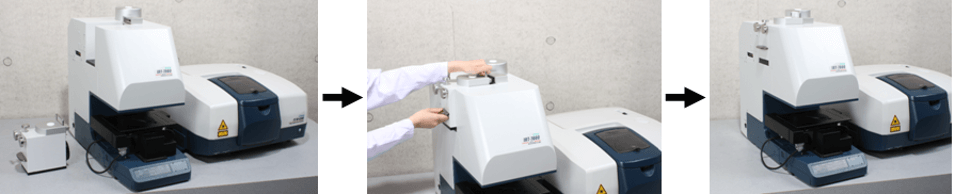
Fig. 1 Detector replacement by using detachable detector unit
Experimental
Imaging of cross section and surface of general medical tablet (pain-killer) was measured by using NIR Microscope system.
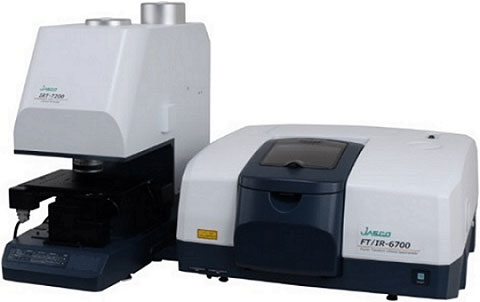
FT/IR-6700 + IRT-7200 FTIR microscope system
Measurement Condition
Multi channel IR Microscope (NIR version)
– Light source : Halogen
– Beam Splitter : CaF2
– Detector : InGaAs (Single element)
– Measurement mode : Reflection
– Resolution : 8 cm-1
– Accumulation : 50 times
– Aperture size : 200 x 200 µm
– Measurement points (Surface) : 58 x 58 points
– Measurement points (Cross Section) : 30 x 40 points
Results
Fig. 2 shows NIR spectra obtained by measuring the point in each layer on cross section of tablet. Fig. 3 is NIR Imaging which describes the color distribution map utilizing the height of each specific peak. As the result, this imaging data (Fig. 3) indicate that this tablet consists of 3 components in 4 different layers.
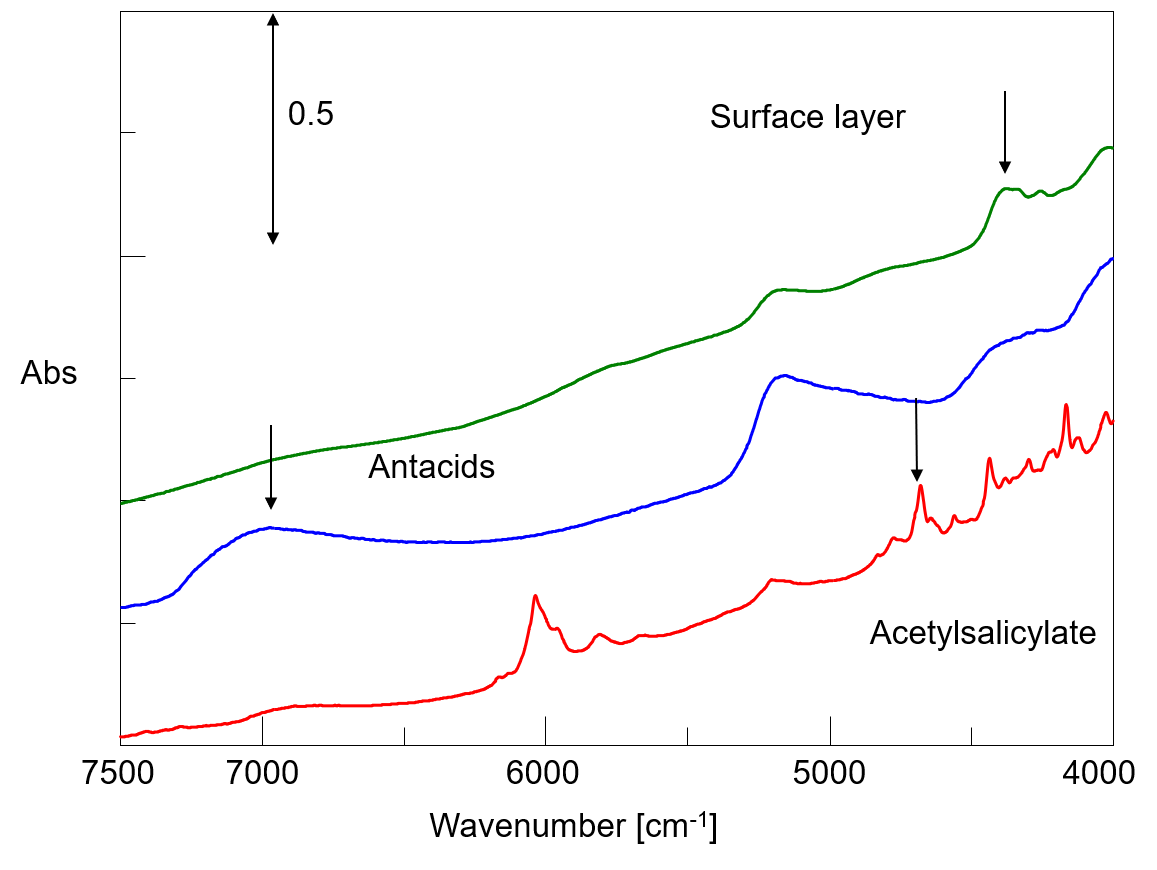
Fig. 2 NIR Spectra of each elements
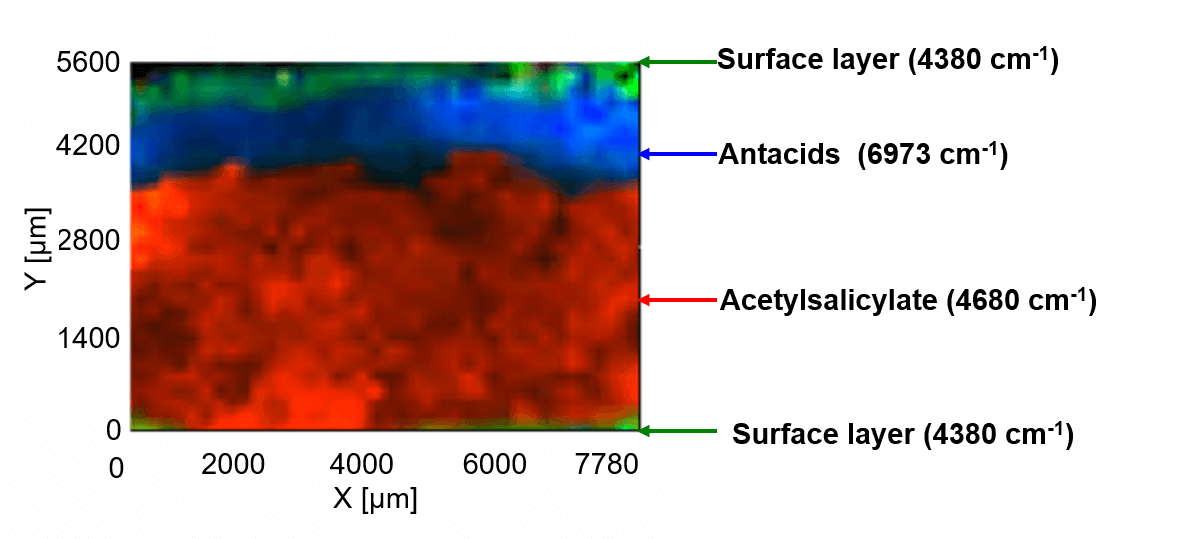
Fig. 3 NIR Imaging of tablet cross section
In addition tablet surface was measured and the color distribution map of surface layer was obtained by utilizing the peak height ratio of Acetylsalicylate. This result clearly shows non-uniformity of surface material as shown in Fig. 4.
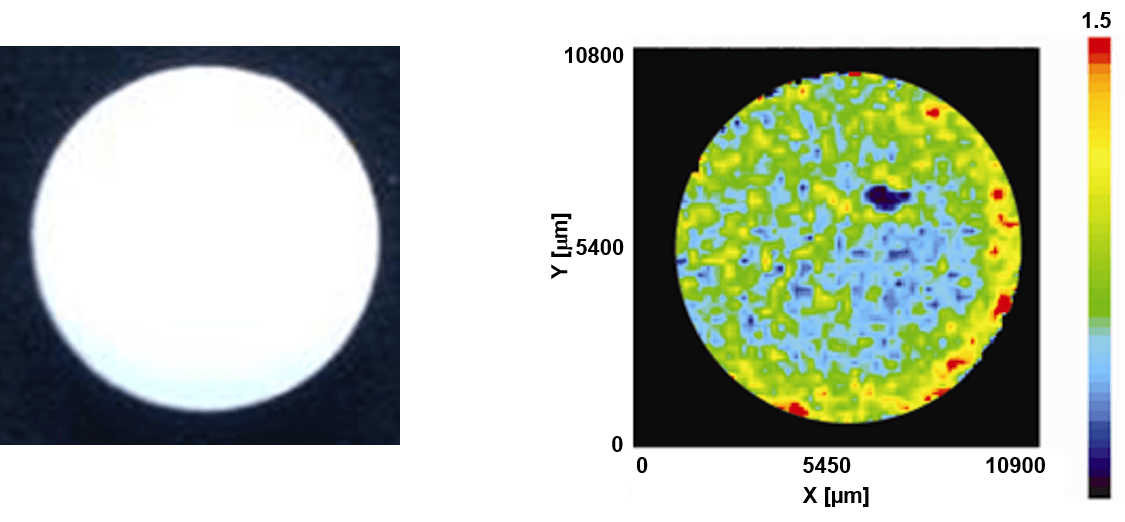
Fig.4 Picture of general medical tablet (Pain-killer, left) and imaging of surface layer Peak ratio : 4380 cm-1/4680 cm-1 (right)
Conclusion
As a conclusion, it can be said NIR Micro Imaging system enables to visualize tablet surface by non-destructive method. Such application is considered to be a very useful tool and solution in the fields of pharmaceutical development and quality control, where there are uncertain factors during the process.


