Introduction
It is hard to measure and identify each component on the non-uniformly distributed multi-components sample. And those several components are measured as single component sometimes as an error. In such case, it is extremely difficult to separate and analyze each component accurately on the search programs consists of the spectra database based on single component.
JASCO IR microscope with 16-element linear array-type MCT detector can perform mapping measurements 100 times quicker than conventional method using single element, and can identify all components with the narrow aperture size.
This article shows the IR mapping measurement result of foreign substances in resin sample. After microscopic mapping measurement, the characteristic spectra obtained from each region were analyzed by the search program.
Experimental
Sample is hold between KBr plates and foreign substances in the resin sample is measured under transmission method using IR microscope.
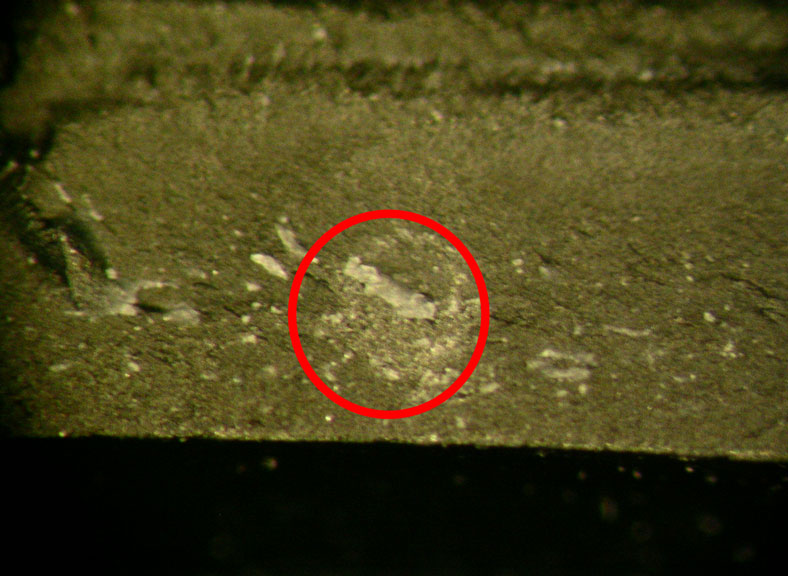
Figure 1. Foreign compounds in resin
Measurement conditions
Detector: Linear array MCT (16 elements)
Accumulation : 50
Objective mirror: 16x cassegrain
Measurement area: 600 x 600 µm (48 x 48 points)
Resolution : 8 cm-1
Measurement method: Transmission
Measurement time: Approx. 10 minutes
Results
Spectra with three different shapes were extracted from the mapping measurement results from the foreign substances and it was analyzed by using of the search program (Figure 2, 3 and 4). Three components were identified as: cellulose, polyester, and organic silicon. It was confirmed that the foreign substances consist of multiple components.
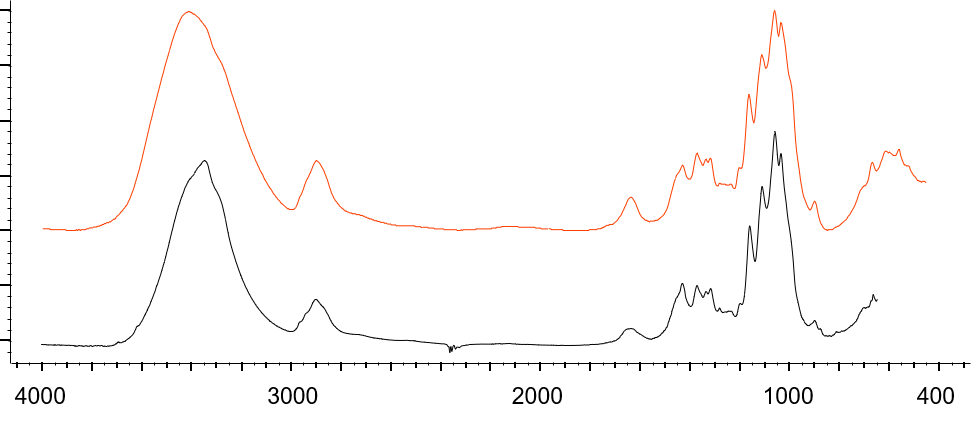
Figure 2. Search result 1 (cellulose, black: spectrum of foreign compound, red: spectra search result)
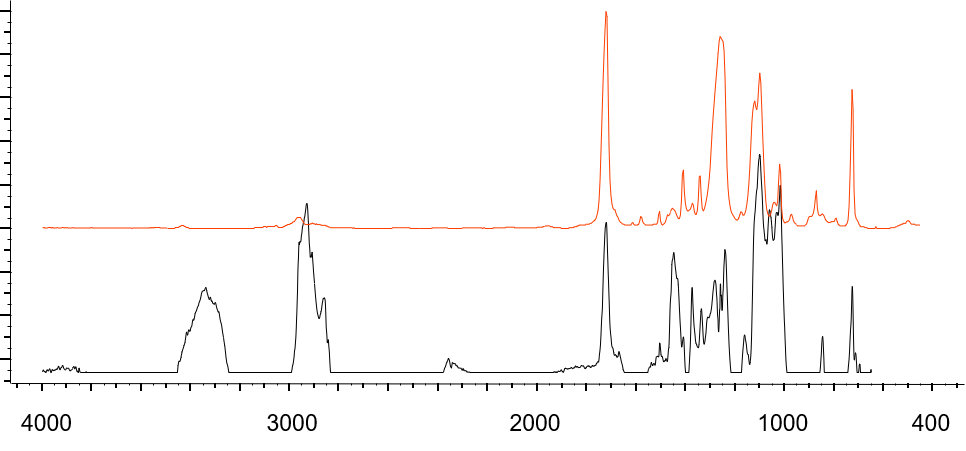
Figure 3. Search result 2 (polymer, black: spectrum of foreign compound, red: spectra search result)
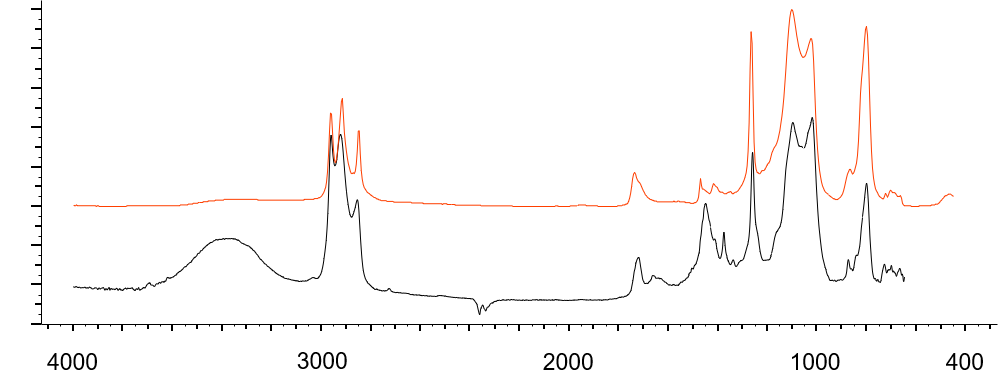
Figure 4. Search result 3 (organic silicon, black: spectrum of foreign compound, red: spectra search result)
In addition, creating the color-coded image by using the key bands in the above spectra, distribution state of the each component could be shown clearly (Figure 5).
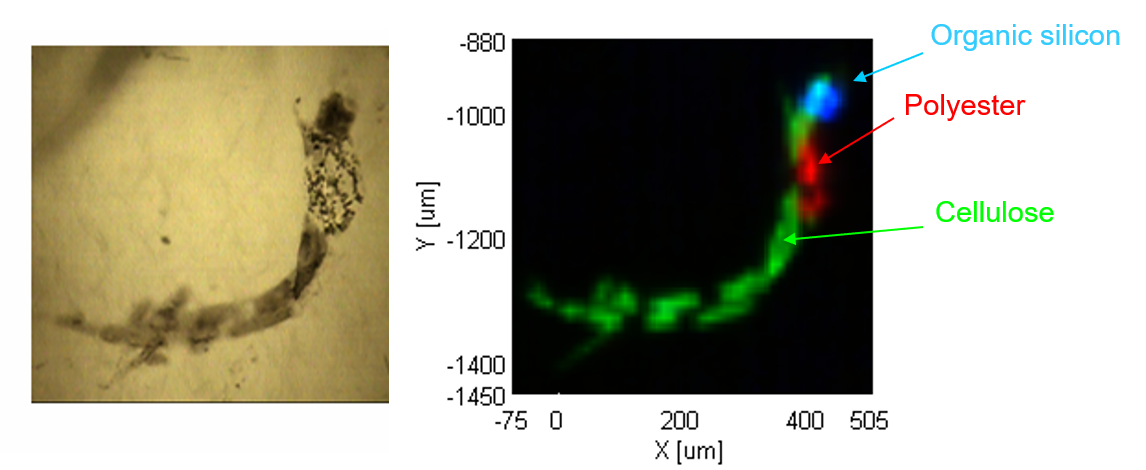
Figure 5. Observed image of foreign compounds and distribution state (RGB display, green: cellulose (3344 cm-1) , red: polyester (1261 cm-1), blue: organic silicon (1800 cm-1))


