Introduction
It is generally understood that chiral compounds have different bioactivities depending upon the absolute configuration of each compound. Some familiar examples include glutamic acid and thalidomide. L-glutamic acid demonstrates the “Umami” taste*1, while D-glutamic acid has a bitter taste, similarly, the R form of thalidomide is a sedative, but the S form has teratogenic activity. Thus, the separation and study of chiral compounds is critical for many reasons.
The functionalities of chiral compounds have been studied for the development of advanced molecules for many applications. The study of chiral compounds has spread to several fields such as natural products, pharmaceuticals and other functional molecules, and it can be pointed out that among those studies, the structural analysis of chiral compounds is a very important topic. X-ray Diffraction (XRD), Nuclear Magnetic Resonance (NMR) and Electronic Circular Dichroism (ECD) using UV/Vis light are employed as primary methods for the structural analysis of chiral compounds. In this paper, the measurement of chiral compounds by Vibrational Circular Dichroism (VCD) using infrared light will be outlined.
VCD is a method to measure the difference of absorbance intensity between left-hand and right-hand circularly polarized light as shown in Figure 1.
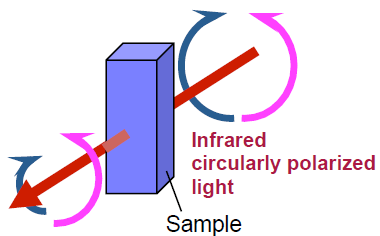
Figure 1: Principles of VCD spectroscopy
It is an advantage of VCD that this method can be applied to almost all organic compounds in the same way as infrared (IR) spectroscopy. In addition, by comparing the measurement results with calculated results by ab-initio molecular orbital calculations, the absolute configuration of the sample can be determined. However, since the peak intensity of VCD spectra are 1,000 – 10,000 times weaker than that of standard IR spectra, spectroscopic instruments with high sensitivity and stability with very small baseline fluctuations are required. The FVS-6000 VCD system has a high sensitivity detector, suitable optical filter technology and a thermostatted Photo Elastic Modulator (PEM) to accurately measure the weak VCD peaks. The measurement results of typical chiral compounds and hemoglobin as a model protein using the FVS-6000 are reported.
*1 Umami taste is the fifth taste sensation in addition to sweet, acid, salty and bitter taste.
Experimental
Measurement parameters
| Model name: | FVS-6000 |
| Resolution: | 4 cm-1 |
| Detector: | MCT-V |
| Accumulation: | 1000 (alpha-pinene and 1,1′-Bi-2-naphthol), 2500 (proline), 2000 (hemoglobin) |
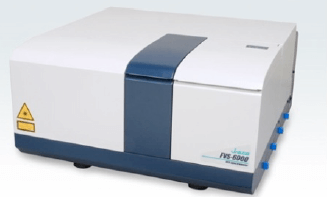
Figure 2: External view of the FVS-6000
Results
Figures 3 through 6 illustrate the measurement results for alpha-pinene; 1,1-Bi-2-naphthol; proline and hemoglobin, respectively. Both IR and VCD spectra can be obtained by the FVS-6000. The identification of the absolute configuration of chiral compounds can be determined from both the IR and the VCD spectra as well as the analysis of the molecular structure.
Figure 3 demonstrates the IR and VCD spectra of alpha-pinene which is a typical standard sample to validate a VCD instrument system. IR spectra of the R- and S- form of alpha-pinene are completely overlapped, while their VCD spectra are symmetric, clearly identifying each alpha-pinene enantiomer. Since the peak shapes of the VCD spectra obtained illustrate typical alpha-pinene spectra, it is confirmed that high quality VCD spectra can be measured by the FVS-6000.
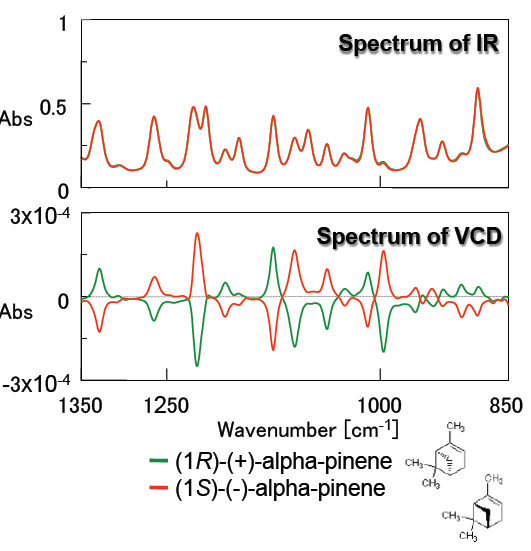
Figure 3: Spectra of alpha-pinene (neat, 50 micron pathlength BaF2 liquid cell)
Figure 4 outlines measurement results for 1,1-Bi-2-naphthol which is used as a ligand for transition-metal catalyzed asymmetric synthesis and is a precursor for chiral ligands such as BINAP. The small peaks due to the anisotropy factor “g value” (VCD peak/IR peak) around 1600 and 1500 cm-1 attributed to the benzene ring are clearly shown. These results demonstrate that the FVS-6000 is a very effective system for evaluation of chiral compounds which have similar structures.
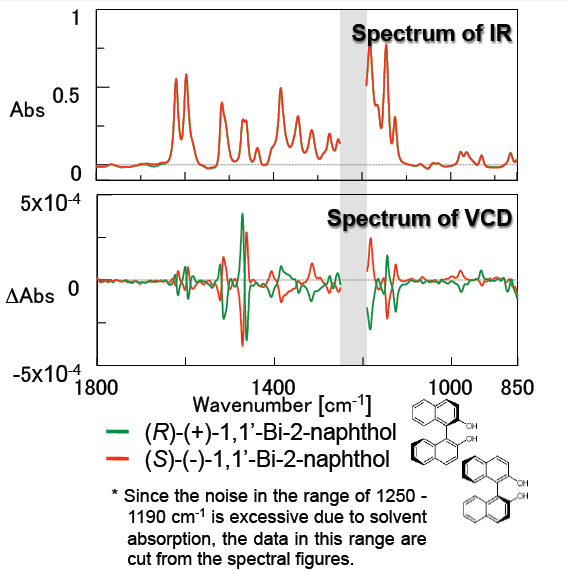
Figure 4: Spectra of 1,1′-Bi-2-naphthol
(solvent: CHCl3, concentration: 0.162 M, 50 micron pathlength BaF2 liquid cell)
Figure 5 illustrates the measurement results of proline which is one of the amino acids. Good, symmetrical VCD spectra were obtained for the D- and L- forms. Since amino acids demonstrate different bioactivities between the D- and L- forms, studies regarding structure and bioactivity are increasingly popular. Liquid samples can be easily measured by VCD instrumentation so the structural analysis of amino acids can be performed similar to physiological conditions.
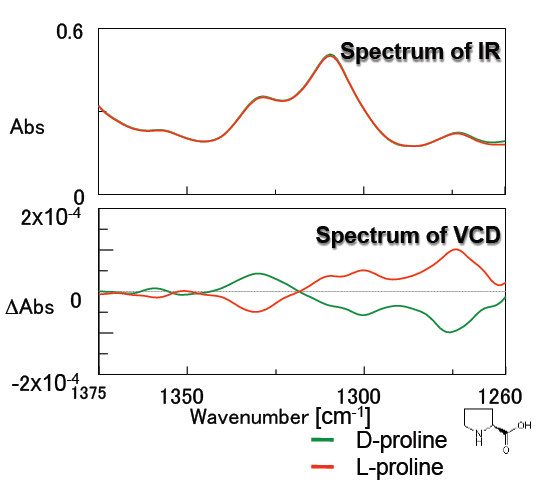
Figure 5: Spectra of proline
(solvent: D2O, concentration: 0.9 M, 25 micron pathlength CaF2 liquid cell)
Figure 6 contains the measurement results for hemoglobin. Hemoglobin is known as a spherical model protein which contains rich alpha-helix structures, and in addition, its VCD spectrum shape is very different from that of concanavalin A, which contains a rich beta-sheet structure.
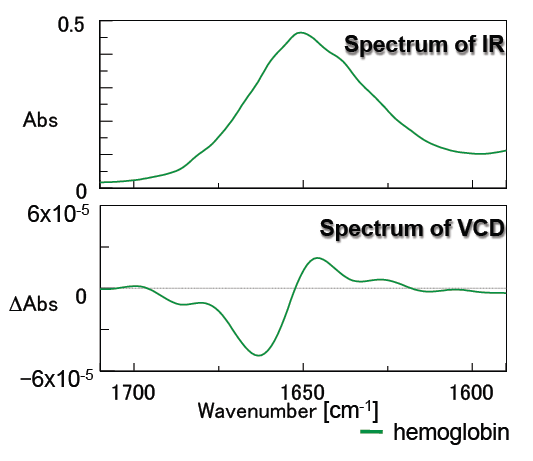
Figure 6: Spectra of hemoglobin
(solvent: D2O, concentration: 50 mg/mL, 25 micron pathlength CaF2 liquid cell)
The addition of VCD spectral results to information obtained from ECD and IR spectra can provide much more accurate secondary structure analysis of proteins in solvents. We also believe that VCD can also be a powerful tool for the analysis of DNA and chiral polymers other than proteins.
Conclusion
In this paper, the standard performance and measurement results of typical chiral compounds using the FVS-6000 were reported and we believe the FVS-6000 can be an essential and indispensable tool for analysis of chiral compounds.
References
About the Author
Leah Pandiscia received her PhD from Drexel University where she studied Biophysical Chemistry. She is a Spectroscopy Applications Scientist at JASCO.


 spectrometer")


