Introduction
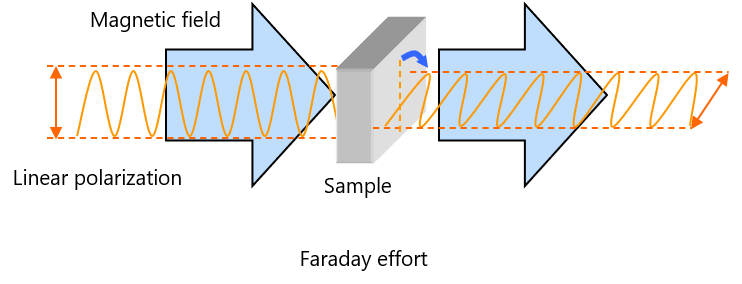
When a linear polarization is passed through the material in the magnetic field parallel to the direction of the magnetic field, the polarization plane is rotated. This phenomenon is termed the Faraday effect after the discoverer, which is regarded as optical activity induced by magnetic field.
ORD and CD are used for the observation of the Faraday effect as well as optically active materials. These experiments are named Magnetic Optical Rotary Dispersion (MORD) and Magnetic Circular Dichroism (MCD), respectively, due to phenomenon induced by the magnetic field. Although both the MORD and MCD can be measured by setting the magnet in the sample compartment for the ORD and CD respectively, MCD is widely used today due to simple measurement and high-sensitivity.
Previously, to generate a strong magnetic field over 1 tesla, a large electrical magnet was used. The electrical magnet cannot be easily set in the sample compartment due to a weight of over 60kg although it has an advantage that measurements can be performed while changing the intensity of the magnetic field. The PMCD-586 permanent magnet (small type) can provide a strong magnetic field of 1.6 tesla. It is also available for the observation of small MCD signals such as a low-concentration sample. In addition, the PMCD-586 magnet can be easily set in the sample compartment due to its small size. The direction of the magnetic field can be changed by a simple switch to the reverse direction.
MCD is a phenomenon which is observed for all materials in principle. The normal CD spectra provides the configuration and conformational information, whereas the MCD spectra provides the electronic state information.
The measurement examples for the neodymium glass, cytochrome C and cobalt chloride (II) 6 hydrate are shown below.
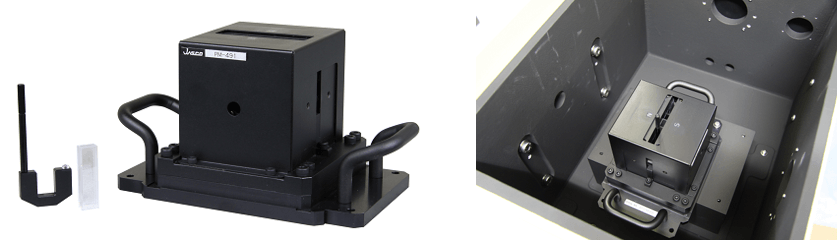
PMCD-586 Permanent magnet, 1.6Tesla
Intensity of magnetic field: 1.6 tesla
Cell length: 5mm (option: 1mm, 2mm)
Experimental
1: MCD of neodymium glass
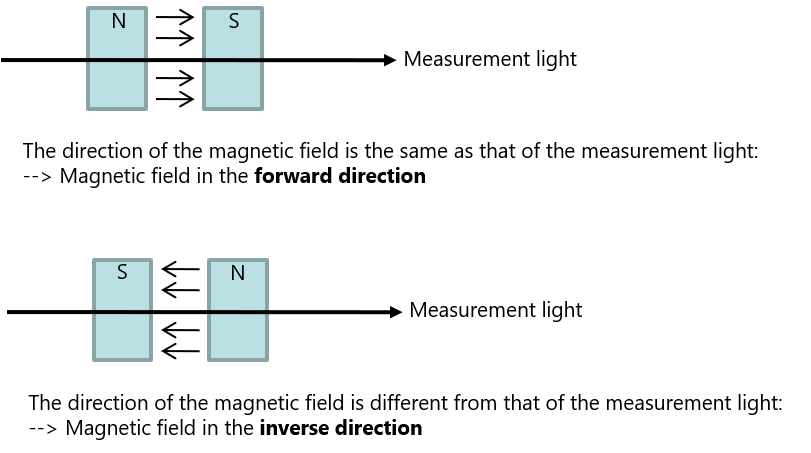
The neodymium glass is optically inactive, however it illustrates MCD spectra from the UV/Vis to the NIR range using the generated magnetic field. Not only do the spectra demonstrate strong sharp MCD signals (Fig.1) which have strong optical absorptions but also the small MCD signals due to weak optical absorptions are displayed (Fig.2) due to the extremely strong magnetic field of 1.6T. MCD spectra can also separate sharp peaks which cannot separates in the absorption spectra. In this application note (please see the “supplemental explanation” in the last page), if the direction of the magnetic field is the same as that of the measurement light, it is defined as the magnetic field in the forward direction. If the direction of the magnetic field is different from that of the measurement light, it is defined as the magnetic field in the inverse direction. By changing the direction of the magnetic field, the code of the MCD spectra is also reversed.
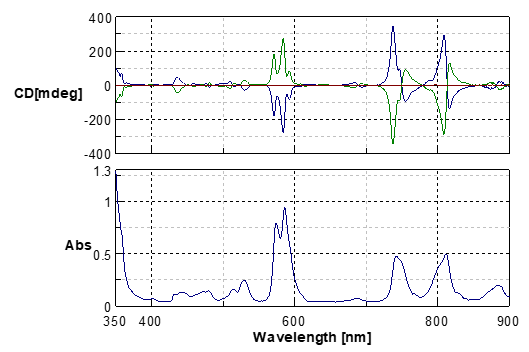
Fig.1 MCD and absorption spectra of a neodymium glass sample (900-350nm)
Blue line: Magnetic field in the forward direction
Green line: Magnetic field in the inverse direction
Red line: without magnetic field
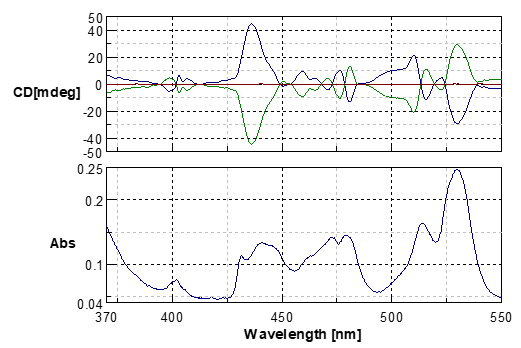
Fig.2 MCD and absorption spectra of the neodymium glass (550-370nm)
Blue line: Magnetic field in the forward direction
Green line: Magnetic field in the inverse direction
Red line: without magnetic field
2: MCD of Fe (III) cytochrome c (derived from equine heart)
MCD is widely used for the structural analysis of hemoprotein samples, and several studies of myoglobin 1), hemoglobin 2) , cytochrome b5 3, 4) , cytochrome c 3, 5, 6) , cytochrome P-450 7) and horseradish peroxidase 8) are reported. The measurement examples for the MCD spectra in the Soret band of the Fe (III) cytochrome C solution are shown below.
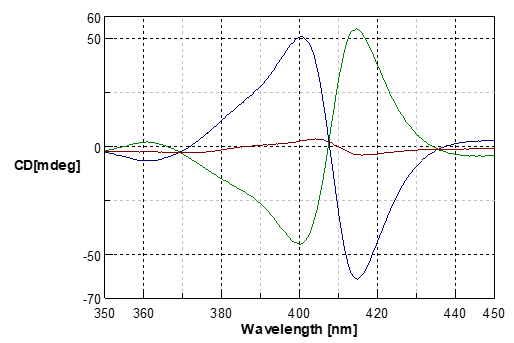
Fig.3 MCD spectra and CD spectrum of the Fe (III) cytochrome C
Blue line: Magnetic field of forward direction
Green line: Magnetic field of inverse direction
Red line: without magnetic field (CD spectra)
If the CD spectrum obtained with the non-magnetic-field condition is subtracted from the MCD spectra, the symmetric MCD spectra can be observed.
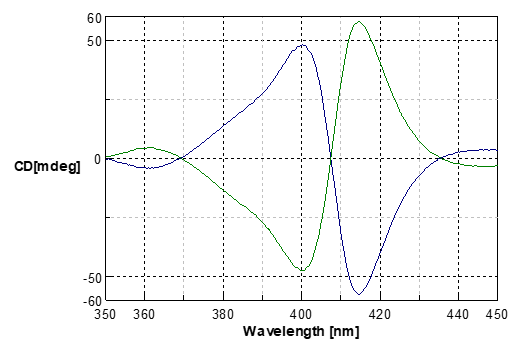
Fig.4 MCD spectra of the Fe(III) cytochrome C (after subtraction of the CD spectrum)
Blue line: Magnetic field of forward direction
Green line: Magnetic field of inverse direction
3: MCD of cobalt chloride (II) 6 hydrate
An aqueous solution of cobalt chloride (II) 6 hydrate exists in a 6-coordinate structure of the octahedron type in which the cobalt ion is coordinated with 6 water molecules (Figure 5). By contrast, the cobalt chloride (II) 6 hydrate in a concentrated hydrochloric acid solution is a 4-coordinate structure of a tetrahedron type in which it is coordinated with 4 chloride ions (Figure 6). The MCD spectra demonstrate drastic changes based on the change in the electronic state of the cobalt ion with high-sensitivity 9).
[Co(H2O)6]2+ + 4Cl– ⇄ [CoCl4]2- + 6H2O
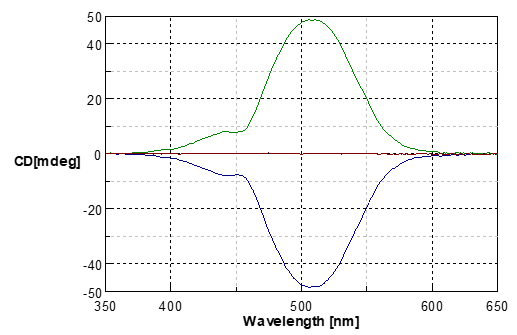
Fig.5 MCD spectra of cobalt chloride (II) 6 hydrate in aqueous solution
Blue line: Magnetic field in the forward direction
Green line: Magnetic field in the reverse direction
Red line: without magnetic field
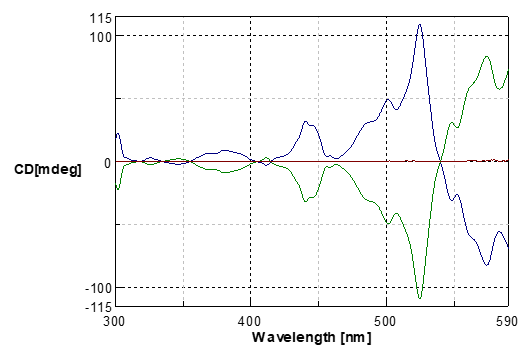
Fig.6 MCD spectra of cobalt chloride (II) 6 hydrate in concentrated hydrochloric acid
Blue line: Magnetic field in the forward direction
Green line: Magnetic field in the reverse direction
Red line: without magnetic field
Supplemental explanation: Directional relation between measurement light and magnetic field
Keywords
Faraday effect, Magnetic Circular Dichroism, Magnetic Optical Rotary Dispersion, cytochrome C, Soret
References
(1) L. Vickery, T. Nozawa, and K. Sauer, J. Am. Chem. Soc., 98, 343 (1976)
(2) S. Yoshida, T. Iizuka, T. Nozawa and M. Hatano, Biochim. Biophys. Acta., 405, 122 (1975)
(3) L. Vickery, T. Nozawa, and K. Sauer, J. Am. Chem. Soc., 98, 351 (1976)
(4) L. Vickery, A. G. Salmon, and K. Sauer, Biochim. Biophys.Acta, 386, 87 (1975)
(5) B. Briat, D. Berger, and M. Leliboux, J. Chem. Phys., 57, 5606 (1972)
(6) N. Kobayashi, T. Nozawa, and M. Hatano, Bull. Chem. Soc. Jpn., 54, 919 (1981)
(7) T. Shimizu, T. Nozawa, M. Hatano, Y. Imai, and R. Sato, Biochemistry,14, 4173 (1975)
(8) T. Nozawa, N. Kobayashi, and M. Hatano, Biochim. Biophys. Acta., 427, 652 (1976)
(9) D. A. Schooley, E. Bunnenberg, and C. Djerassi, Chemistry, 53, 579, (1965)
 spectroscopy")


 spectrometer")
