Introduction
Enantiomers in chiral substances can be produced via methods like asymmetric synthesis, crystallization, enzymatic reactions, and optical resolution. Among these, HPLC with chiral stationary phases and, more recently, supercritical fluid chromatography (SFC) have been widely used, especially in pharmaceuticals. SFC offers faster separation and easier solvent removal due to the features of supercritical CO₂ evaporation. Analytical methods like NMR, XRD, ECD, and VCD help identify enantiomers.
In this study, bromuconazole was separated into four isomers using semi-prep SFC and compared with semi-prep LC. We applied fractionated peaks by semi-prep LC to ECD and VCD spectral measurements for determination of their absolute configurations.
Experimental
Pretreatment procedure of fractionated isomers
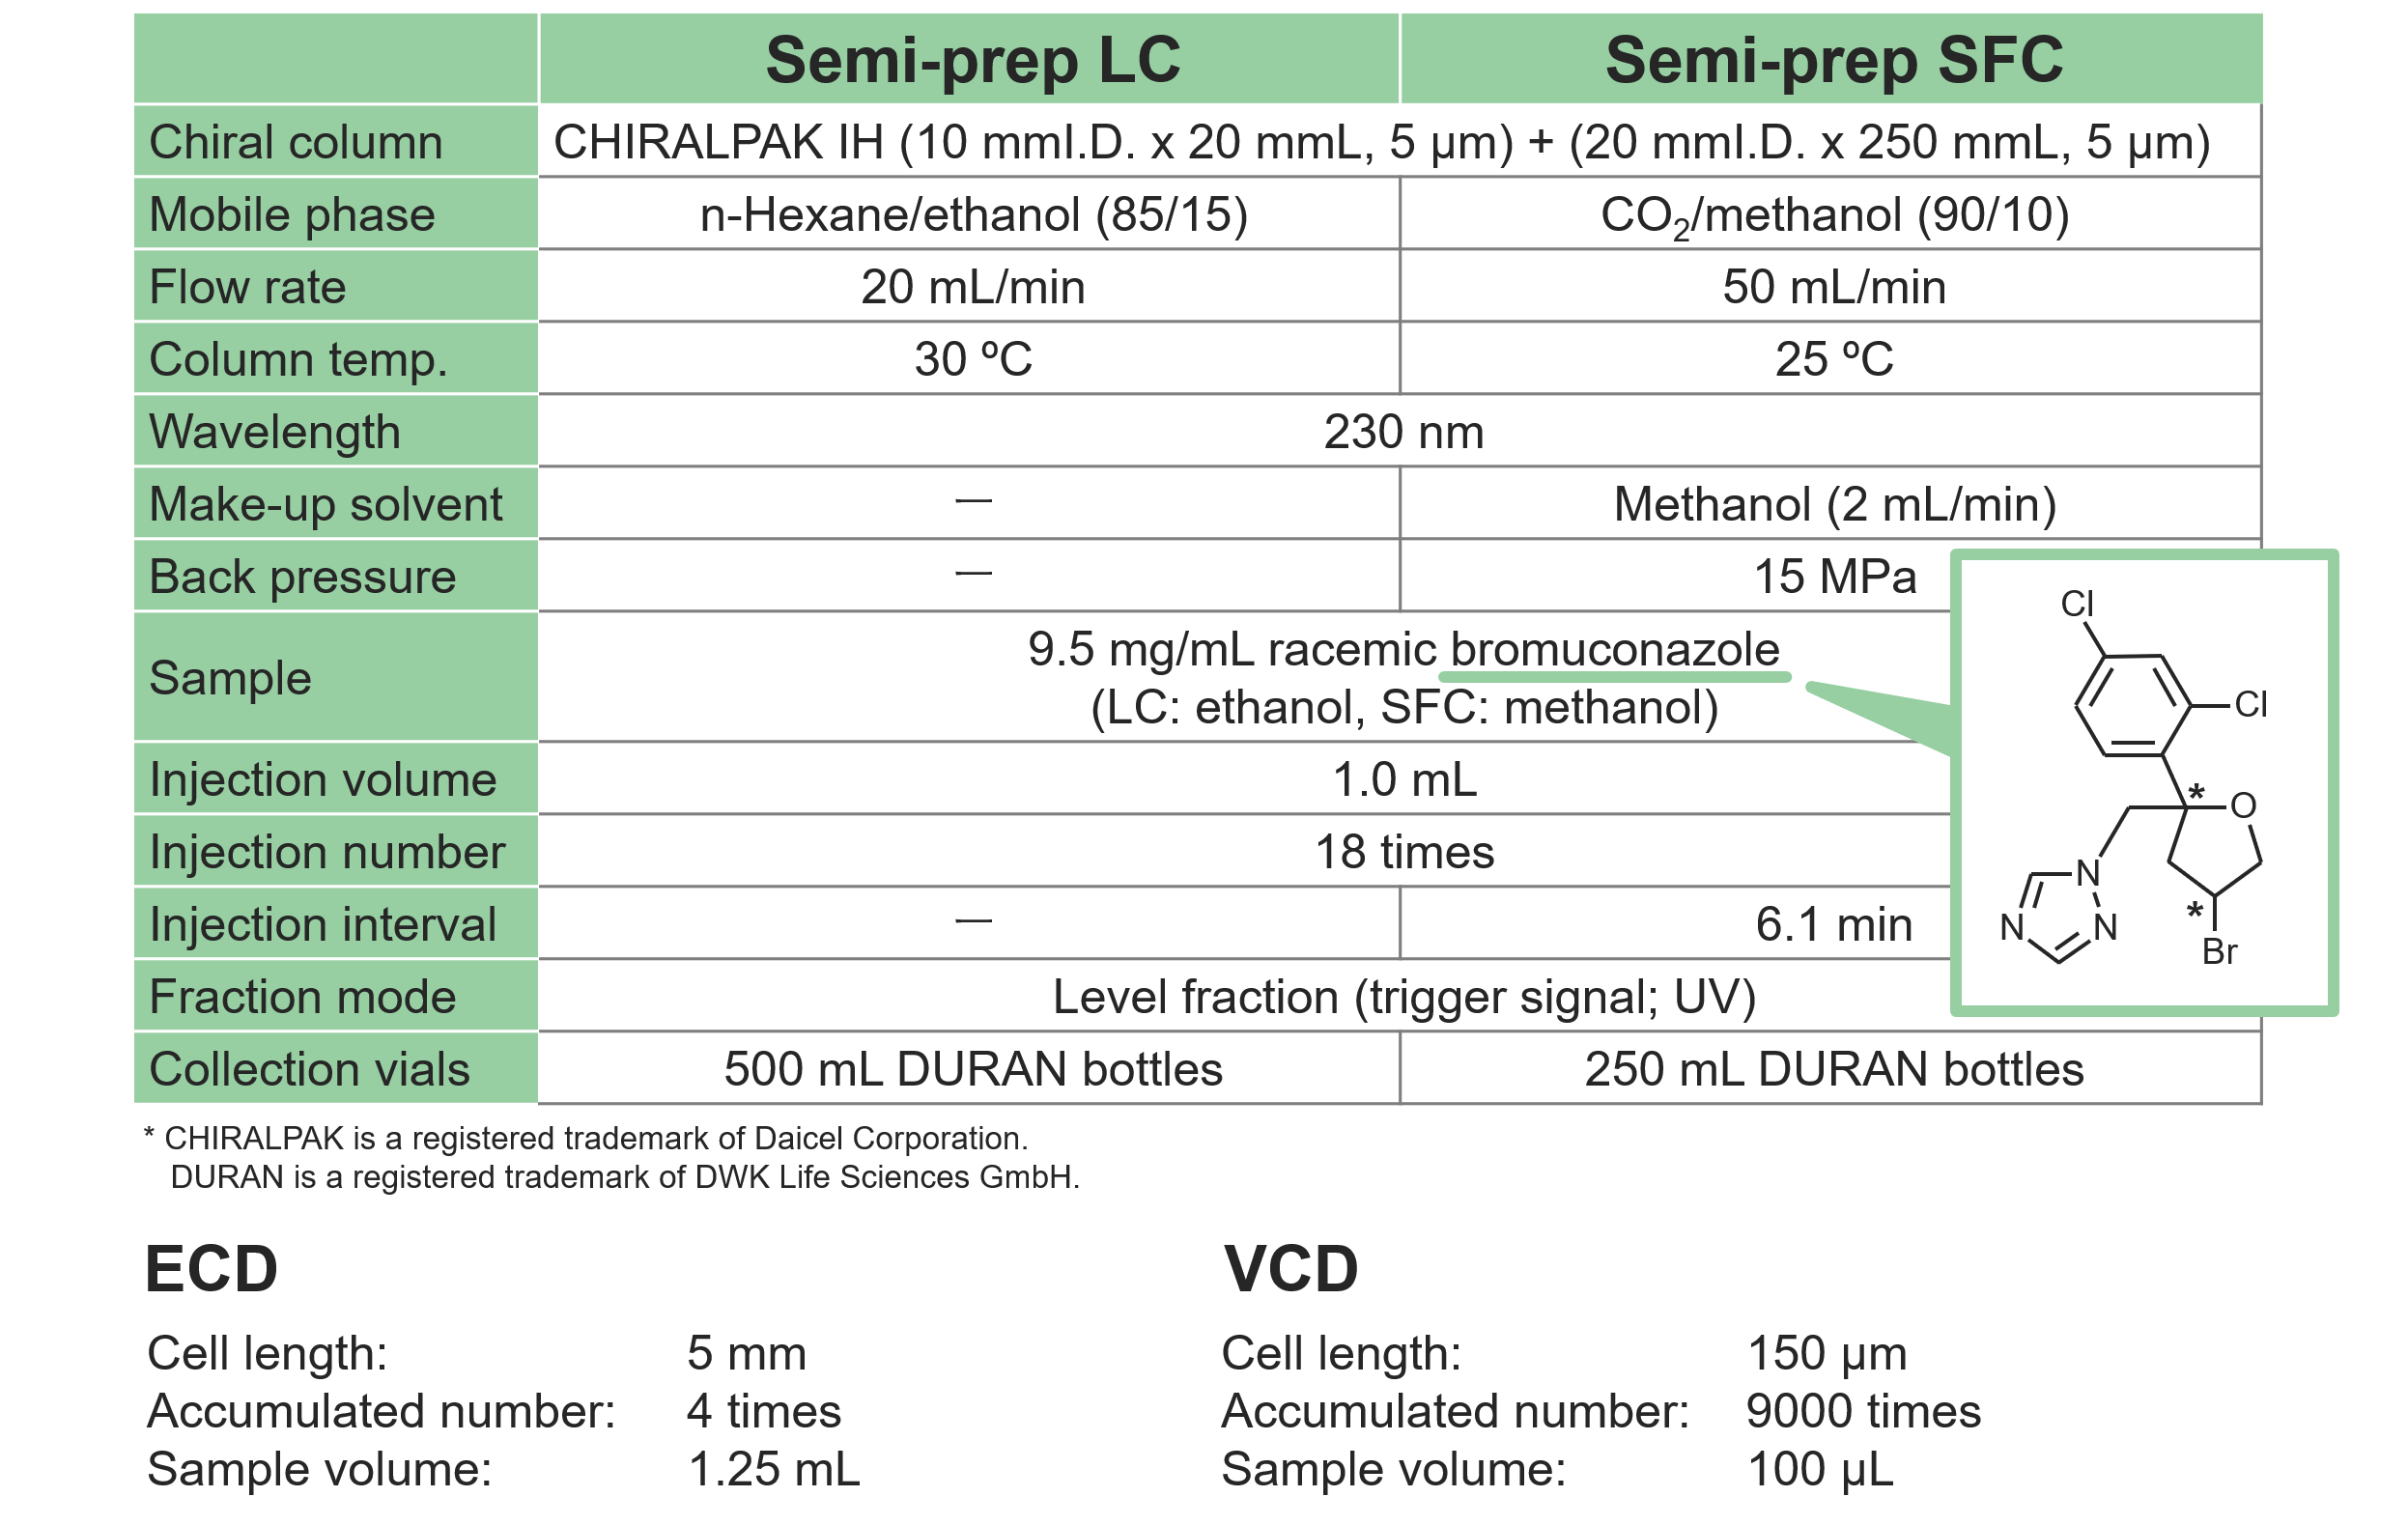
The isomeric peaks fractionated by semi-preparative LC were evaporated to dryness and used for ECD and VCD spectral measurements. For ECD, each sample was dissolved in n-hexane/ethanol (85/15) to a concentration of 0.02-0.03 mg/mL. For VCD, each sample was dissolved in deuterated chloroform to a concentration of 50-70 mg/mL. Detailed procedure is described in the poster (PA01) presented at Chirality 2024.
Results
Isomers fractionated by Semi-prep LC and Semi-prep SFC
Figure 2 shows the collection results of racemic bromuconazole in a single injection. Due to the low CD intensity at 230 nm for peaks 1 and 3, the UV signal was used to trigger for level fraction. The 1st to 4th peaks were collected into vials 1 to 4 by the level fraction. To obtain approximately 40 mg enantiomer each, 18 repeat injections were executed.
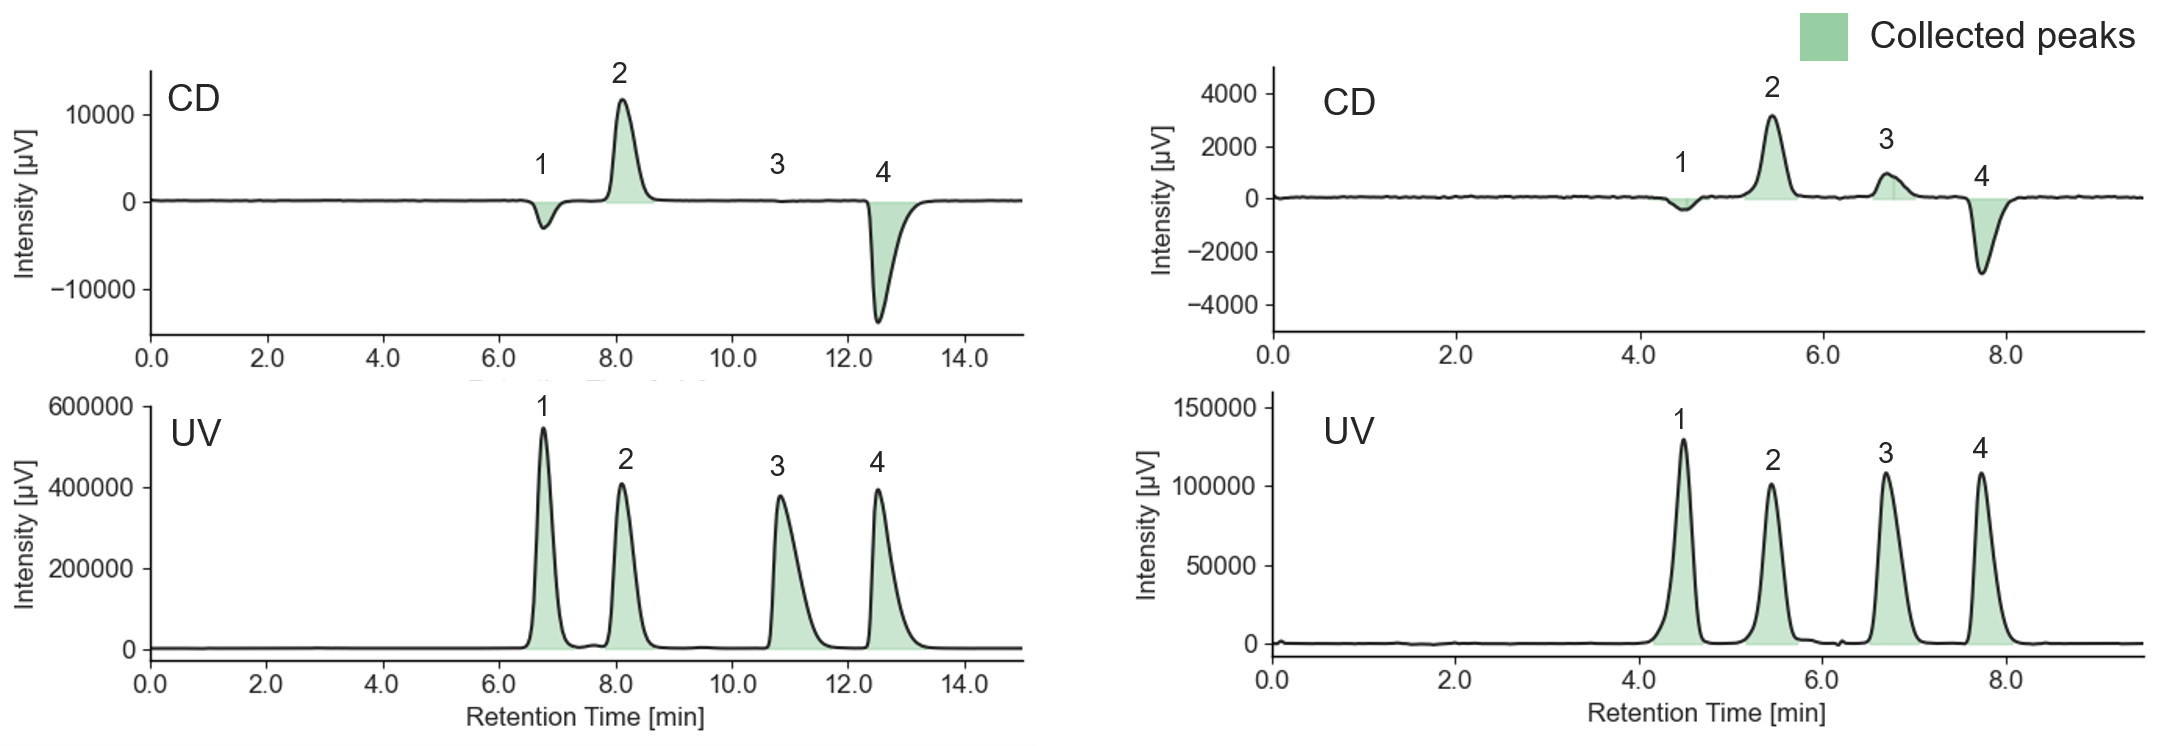
Fig. 2 Collection results in a single injection (Left: Semi-prep LC, Right: Semi-prep SFC)
Comparison of Semi-prep SFC and Semi-prep LC in terms of run time and solvent consumption
Figure 3 shows the comparison of results of 18 repeat injection by semi-prep LC and semi-prep SFC. Table 2 compares the run time, solvent consumption, and collection volume in each measurement method. Stacked injection by semi-prep SFC could reduce run time to less than half, organic solvent consumption to about 1/10, and collection volume to about 1/3 compared to that of semi-prep LC. Table 2 shows the recovered amount (dry weight) of each enantiomer by semi-prep SFC and their enantiomeric excess. These enantiomeric samples were determined to be sufficient in quantity to be applied for subsequent ECD and VCD measurements.
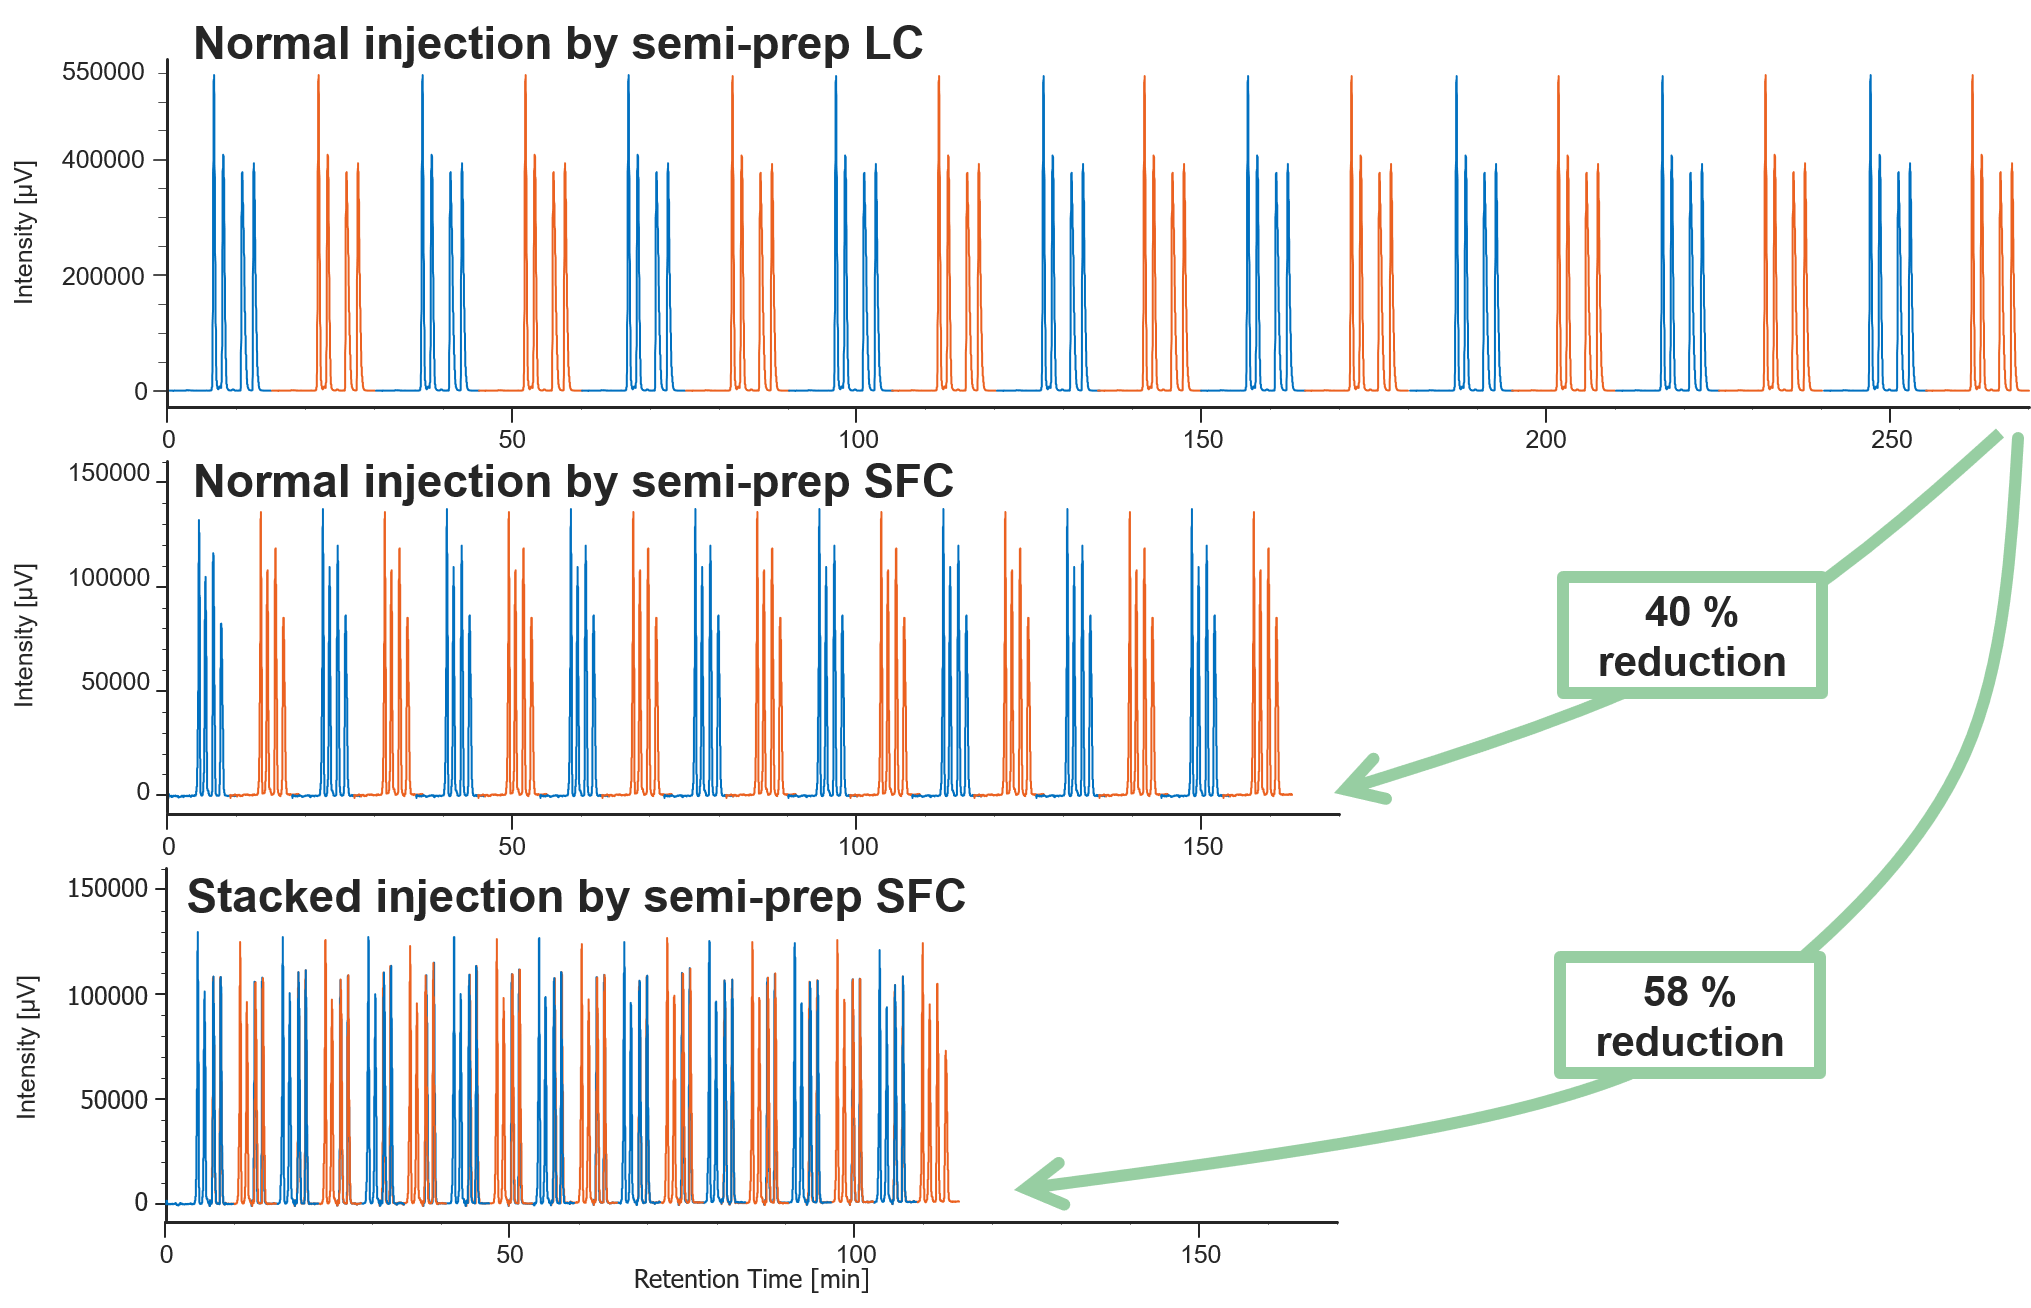
Fig. 3 Comparison of results of 18 repeat injections
Table 1 Comparison of run time, solvent consumption, and collection volume
| Measurement method | Run time | Solvent consumption | Collection volume |
| Normal injection by semi-prep LC | 4.5 hr | 5.4 L | 210-360 mL |
| Normal injection by semi-prep SFC | 2.7 hr | 0.8 L | 70-100 mL |
| Stacked injection by semi-prep SFC | 1.9 hr | 0.56 L | 70-100 mL |
Table 2 Recovered amount and purity of each enantiomer of bromuconazole
| Peak 1 | Peak 2 | Peak 3 | Peak 4 | |
| Recovery amount | 40.7 mg | 37.8 mg | 40.7 mg | 37.4 mg |
| Recovery rate | 95.3 % | 88.5 % | 95.1 % | 87.5 % |
| Enantiomeric excess* | 99.9 % | 99.8 % | 99.8 % | 99.9 % |
* Fractionated samples were evaporated to dryness, redissolved in ethanol, and analyzed by an analytical scale SFC system.
Comparison of measured CD spectra with theoretical spectra
The theoretical spectra and absolute configurations of bromuconazole were calculated using Gaussian 16. Figure 4 shows the experimental and calculated ECD and absorbance spectra of bromuconazole isomers. Note that the absorption in experimental spectra had been saturated at short wavelengths below 200 nm due to the UV absorption of ethanol in the dissolving solvent. From the experimental and calculated spectra, taking into account the CD polarity at short wavelengths and its polarity reversal at longer wavelengths, peaks 1 to 4 could be presumed to be 2S,4S-, 2S,4R-, 2R,4R-, and 2R,4S-bromuconazole, respectively.
* Gaussian is a registered trademark of Gaussian Inc. Gaussian 16, Revision C.01, M. J. Frisch et al., Gaussian, Inc., Wallingford CT, 2016.
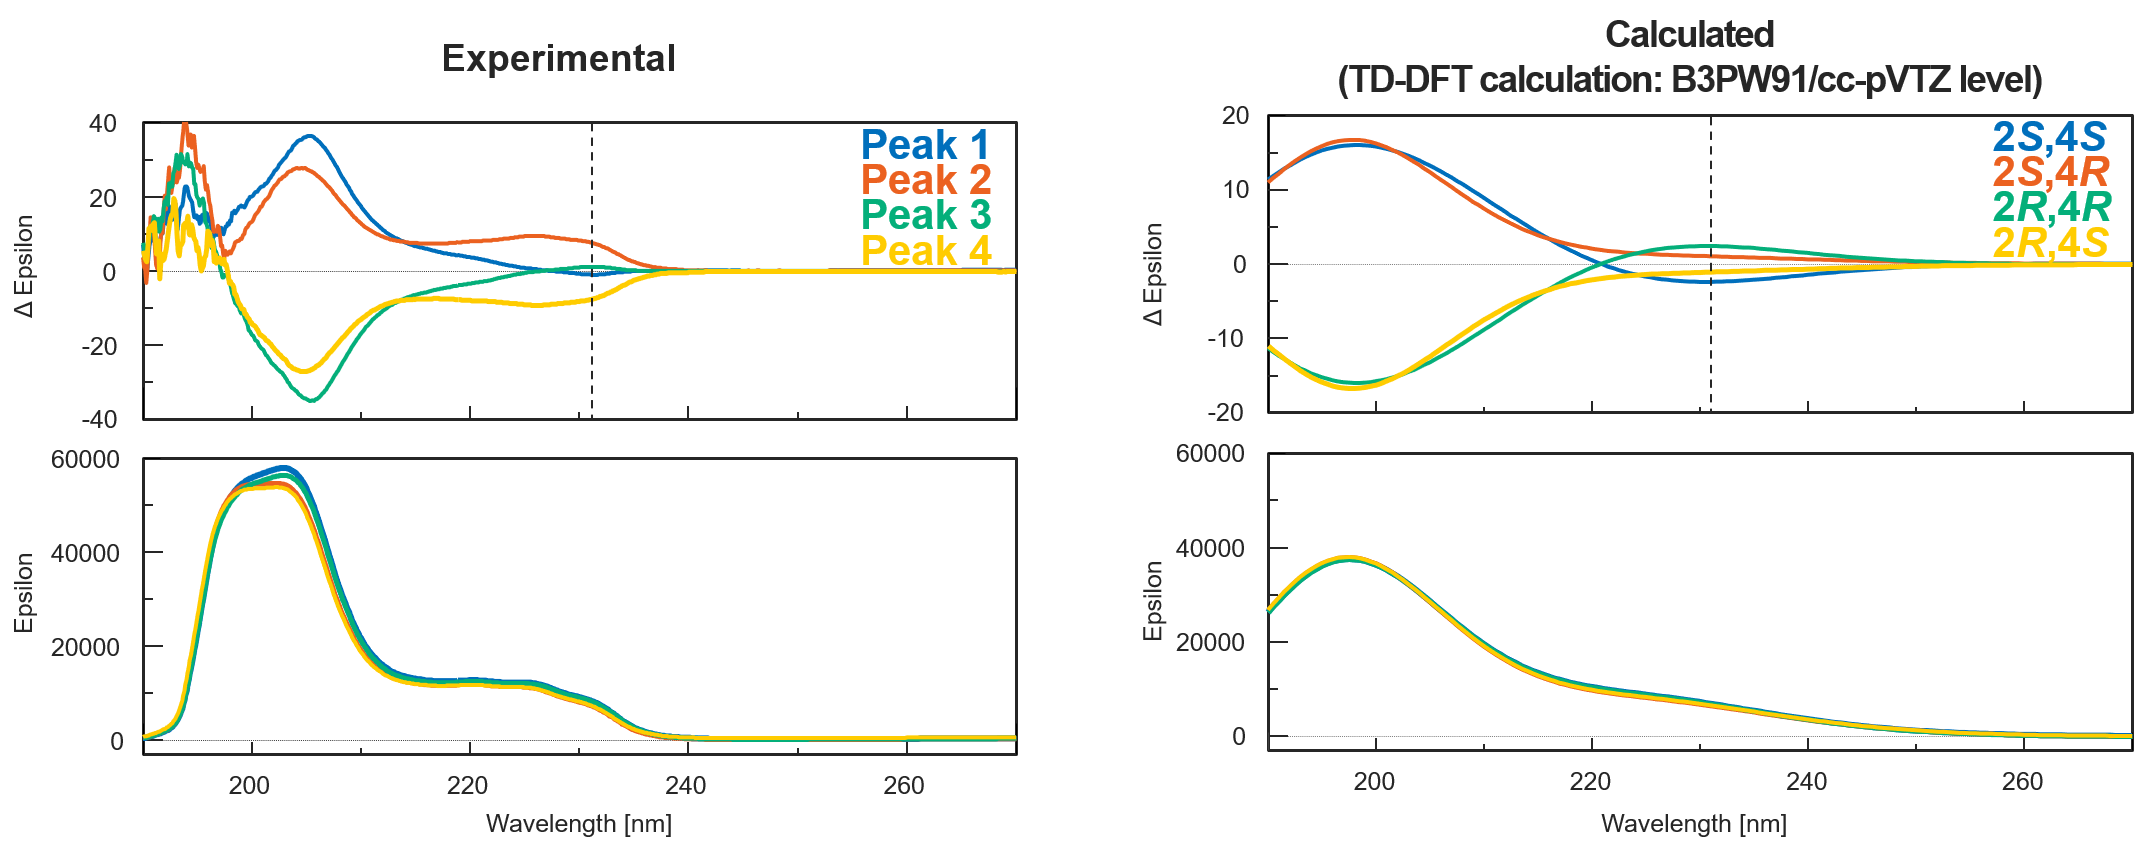
Fig. 4 Experimental and calculated ECD and absorbance spectra of bromuconazole isomers
Figure 5 shows the experimental and calculated VCD and IR spectra of bromuconazole isomers. Especially in the gray range, the pattern of the experimental VCD spectra was in good agreement with the behavior of the calculated spectra. Compared to calculated spectra, the peaks 1 to 4 could be identified to 2S,4S-, 2S,4R-, 2R,4R-, and 2R,4S-bromuconazole, respectively, which is consistent with the ECD results. Fig. 6 shows the absolute configuration of each isomer of bromuconazole obtained by the calculation.
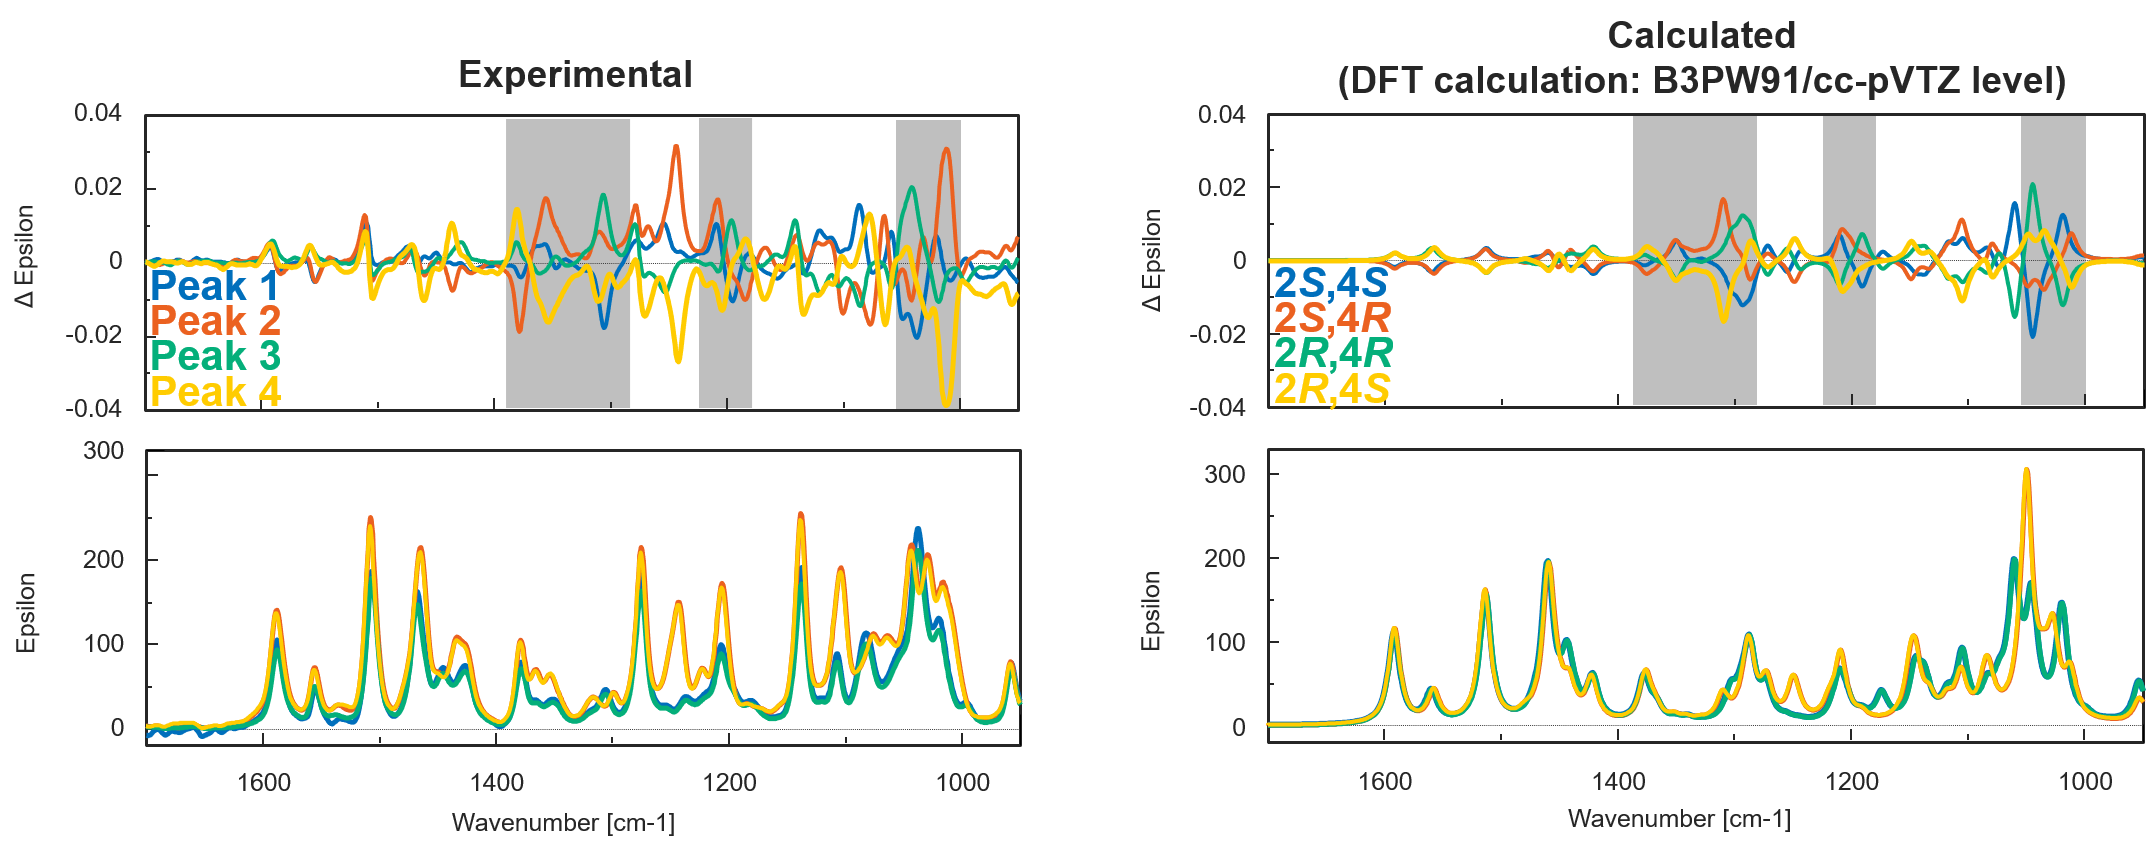
Fig. 5 Experimental and calculated VCD and IR spectra of bromuconazole isomers
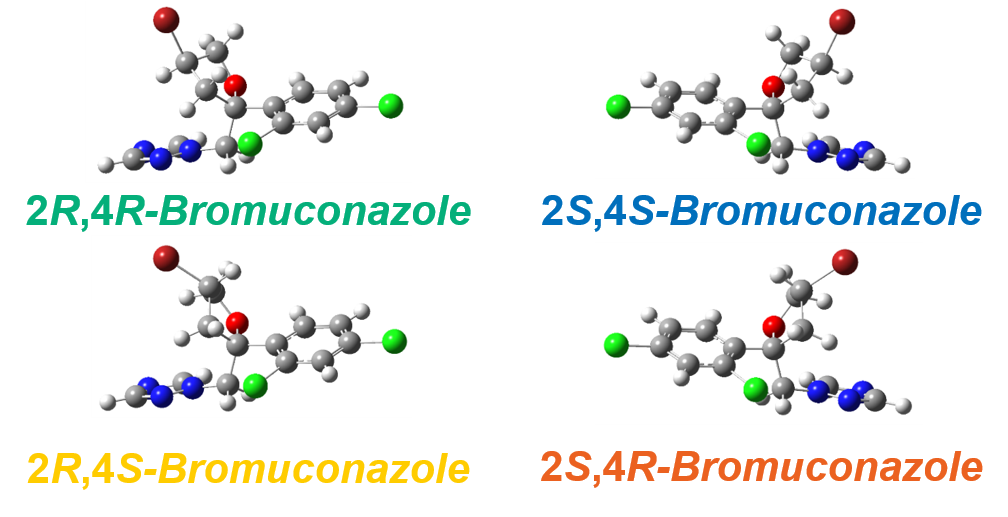
Fig. 6 Absolute configurations of bromuconazole (DFT calculation: B3PW91/cc-pVTZ level)
Conclusion
Semi-prep SFC with stacked injection significantly reduced run time, solvent consumption, and collection volume compared to Semi-prep LC.
The pattern of calculated ECD and VCD spectra of bromuconazole significantly corresponded to those of experimental spectra.
Peaks 1 to 4 could be identified to 2S,4S-, 2S,4R-, 2R,4R-, and 2R,4S-bromuconazole, respectively,
References
Poster Session at 35th International symposium on Chirality (Chirality 2024, July 28 – 31, 2025, in NYC, U.S.A.)
Satoe Iijima, Keijin Iwaya, Takuya Nakamura, Yoshiro Kondo, Satoko Suzuki, and Kengo Yoshida
JASCO Corporation, Hachioji, Tokyo 192-8537, Japan
Related Posts:
") Chiral preparative separation of warfarin using…
Chiral preparative separation of warfarin using…") Achiral preparative separation using Preparative SFC…
Achiral preparative separation using Preparative SFC… Structural Analysis of Chiral Samples with Multiple…
 Rapid Column Screening for Chiral Separation by Parallel SFC
 Comparison of Separation Behavior among Silica-based…
 Analysis of Flurbiprofen and Ketoprofen by SFC-PDA…