Introduction
Raman spectroscopy can be used to analyze the molecular or crystalline structure based on various molecular vibrations. The technique has been applied to analyses of various kinds of organic and inorganic materials such as polymers, chemicals, biological materials, semiconductor or various nanomaterials including graphene and carbon nanotubes. Due to miniaturization, performance improvement and cost reduction of lasers and other optical devices, the cost of Raman spectrometers has been steadily declining. As a result, Raman spectroscopy is now being used for analysis of materials in many fields such as quality control for pharmaceuticals and in the food industry. In comparison with infrared spectroscopy, there are several advantages of Raman including the non-contact, non-destructive nature of Raman, the ease of sampling and that a reduced sample area size can be measured (approx. 1 micron). An additional (and important) advantage, is that measurement in the low wavenumber range can be easily achieved to obtain precise information on inorganic samples. Cosmetic preparations consist of organic and inorganic materials.

In this application note, a method for identification and discrimination of the components in eye shadow samples using Raman micro-spectroscopy is described.
Experimental
Two kinds of eye shadow (manufactured by Company A and Company B) were coated onto a metal plate. The eye shadow applications were measured using a JASCO NRS-4500 Raman micro-spectrometer (Figure 1) to mapping images of the sample applications. The data were analyzed and component materials identified using a Raman chemical search database.
Measurement conditions
Excitation wavelength: 532 nm
Grating: 900 gr/mm
Laser power: 3.2 mW
Objective lens: 100x
Sampling area: 35 x 35 mm
Measurement points: 35 x 35 with 1 mm interval
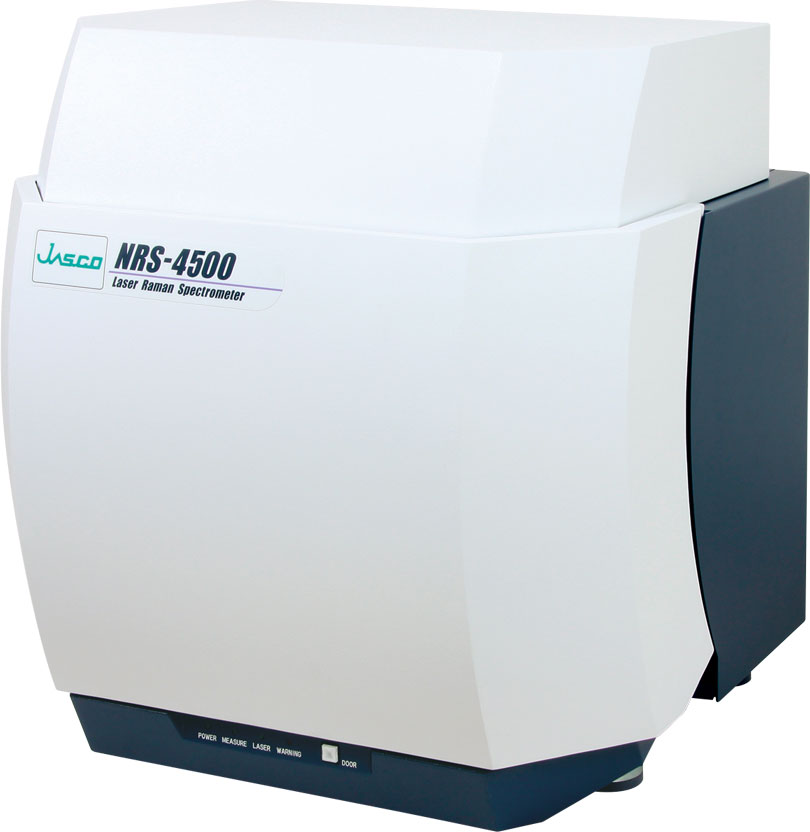
Figure 1. Raman Spectrometer (NRS-4500)
Results
Figure 2 demonstrates the microscopic visual observation image of each eye shadow.
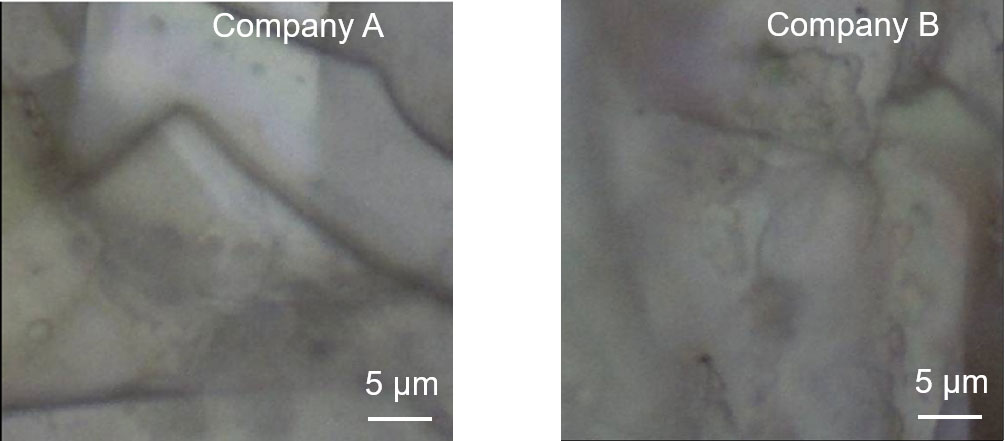
Figure 2. The microscopic visual observation image of each eye shadow
Figure 3 outlines the spectra of the main components of each eye shadow (black spectra are calculated using a PCA model analysis and red spectra are the results of the database search).
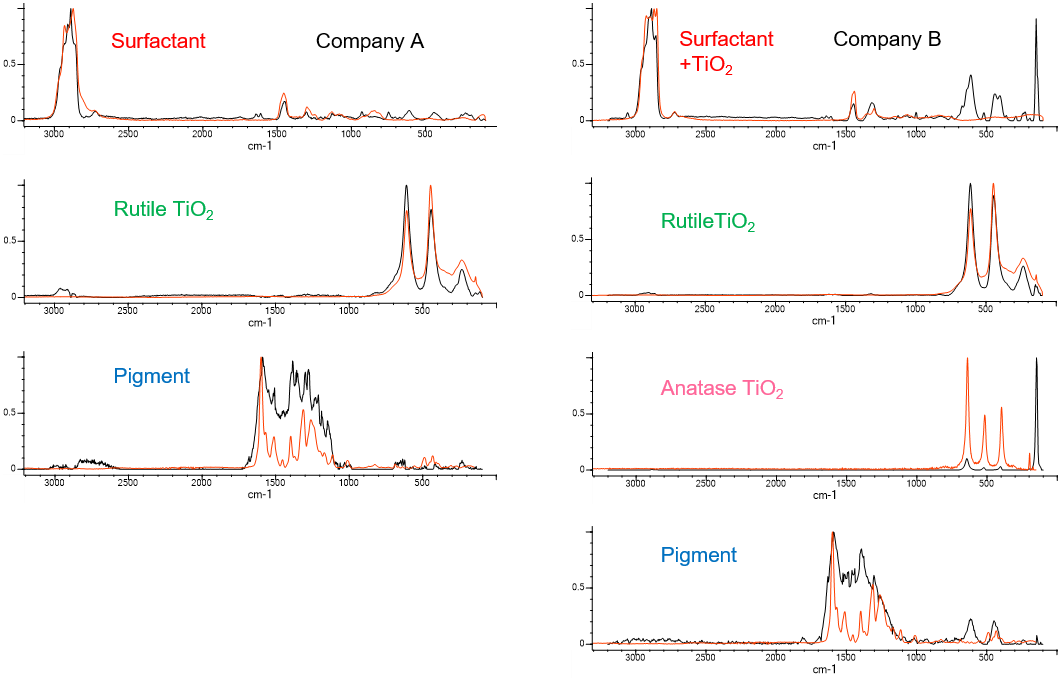
Figure 3. The Raman spectra of each eye shadow
Figure 4 presents the color mapping images of each eye shadow. The visual differences in the particle size or the color of the two kinds of eye shadow cannot be found in the visual observation image (Figure 2).
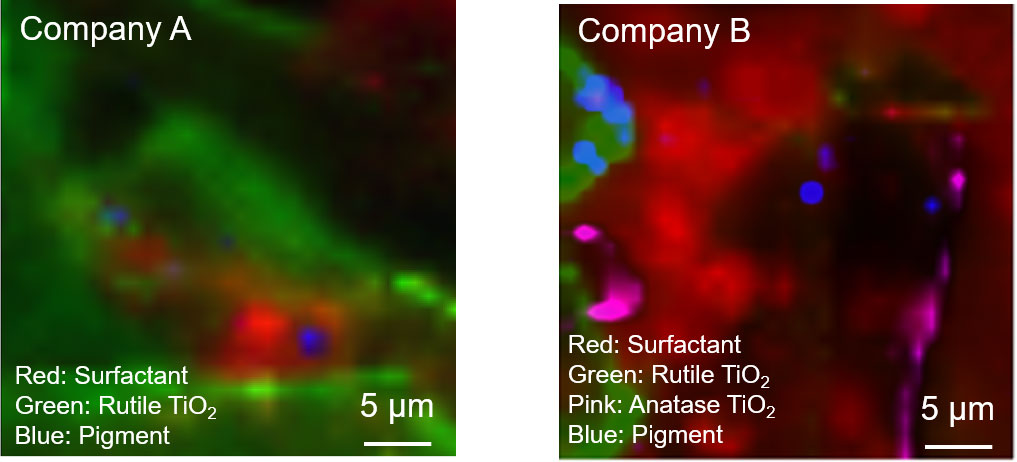
Figure 4. The color mapping image of each eye shadow
The difference between the two kinds of eye shadows can be easily recognized by the spectra shown in Figure 3. The eye shadow made by company A contains a surfactant, rutile TiO2 and pigment. The eye shadow made by company B contains anatase TiO2 in addition to a surfactant, rutile TiO2 and the pigment.
Figure 4 contains the color mapping images of the component distribution for each eye shadow formulation. The differences in component dispersion can be reviewed in the mapping images.
Conclusion
Raman microscopy easily highlights the composition differences in chemical formulations that cannot be discerned by optical or infrared microscopy. As an example, the dispersion of inorganic crystals that demonstrate polymorphism can be easily measured by colored mapping images of the spectral peaks. Raman micro-spectroscopy is effective for measurement of composite materials like cosmetics that contain organic and inorganic material dispersed in discrete micron-sized locations within the chemical formulation.
Related Posts:
 Compositional Analysis of Rocks by using of…
 Identification of Degraded Plastics Cross-checking…
 Microplastics Identification using Macro-ATR Unit…
 Base Material and Dye Analysis - Combined Raman and…
 Quantitation of Glucose in Aqueous Solution using…
 Monitoring Microbial Fermentation using Raman Spectroscopy