Introduction
Heparins are a class of mucopolysaccharide obtained from the porcine small intestine and is widely used in the pharmaceutical field as an anticlotting drug for the treatment and prevention of thromboembolism, treatment of disseminated intravascular coagulation syndrome, and as an anti-blood clotting agent when using extracorporeal blood circulating apparatus such as blood dialysis and artificial heart/lung. Low-molecular-mass heparin is produced by enzymatic treatment and chemical manipulation of heparin and is used as an anticlotting drug similarly to heparin due to its more predictable pharmacokinetics. Low-molecular-mass heparin is classified as parnaparin, dalteparin, enoxaparin etc., by decomposition method and molecular weight distribution.
In the European Pharmacopoeia, the molecular weight measurement method is defined in the pharmaceutical products article of low-molecular-mass heparin, the average molecular weight and molecular weight distribution are also defined in the pharmaceutical article for low-molecular-mass heparin (sodium) and low-molecular-mass heparin (calcium) 1) – 7). Size exclusion chromatography (SEC) combined with a UV-Visible and Refractive Index detection is defined as the measurement method. In the analytical method, a molecular weight calibration curve using low-molecular-mass heparin is created using low-molecular-mass heparin as the reference sample. In common molecular weight measurement methods using SEC, a calibration curve is created from the retention volume and molecular weight; this common method is used for oligomers and polymers where the molecular weight has already been determined and used as a standard sample. However, in this case the molecular weight has to be calculated by standardizing the coefficient and intensity ratio of RI and UV to define the calibration curve. This type of SEC analysis is considered so complicated that it can be difficult to use commercial software.
In this article, we demonstrate the use of the optional Low-Molecular-Mass Heparin Molecular Weight Calculation program for ChromNAV 2.0 to analyze the mass average molecular weight and molecular weight distribution of low-molecular-mass heparins using the method described in the European Pharmacopoeia.
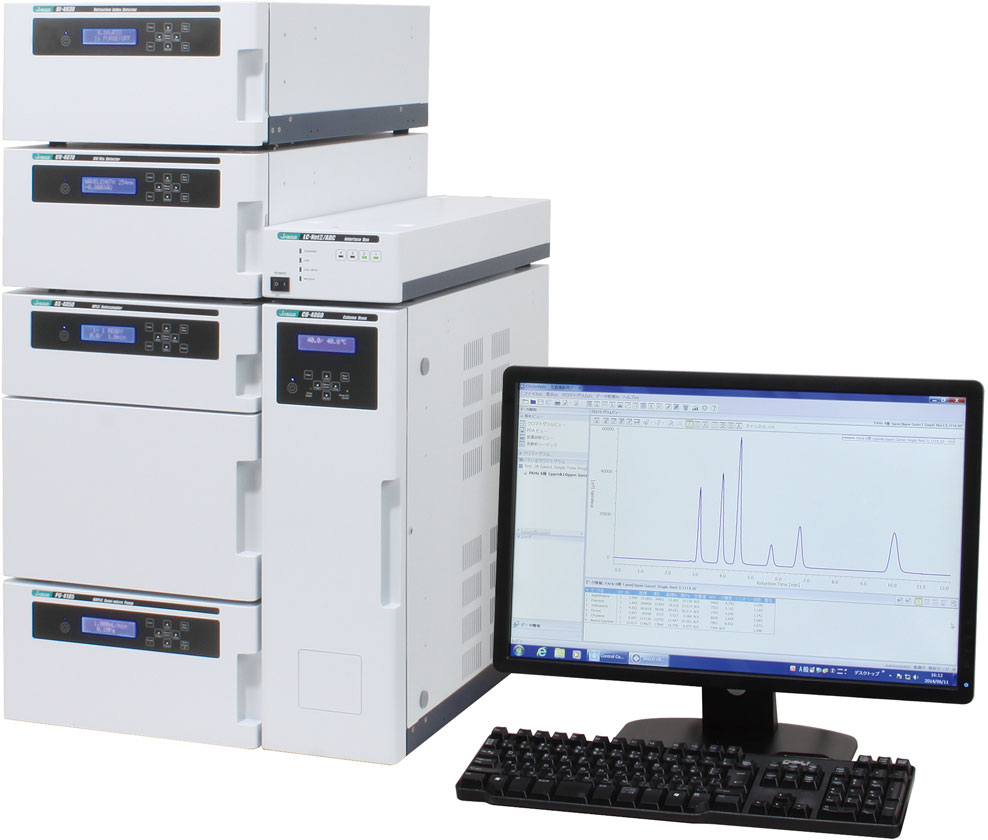
LC-4000 GPC system
Experimental
Chromatographic Conditions
Column: TSKgel G2000SWXL (7.8 mm I.D. x 300 mm L, 5 µm)
Eluent : Aqueous solution of 0.2 M anhydrous sodium sulfate (adjusted to pH 5.0 with 0.05 M sulfuric acid)
Flow rate: 0.5 mL/min
Column temp.: 30 ºC
Wavelength (UV): 234 nm
Injection volume: 25 mL
Standard: 20 mg of low-molecular-mass heparin for calibration CRS* in 2 mL of the eluent (*number average relative molecular mass: 3,800)
Sample: 20 mg of parnaparin sodium CRS in 2 mL of the eluent, 20 mg of dalteparin sodium CRS in 2 mL of the eluent
Structure

Keywords
Heparin analysis by HPLC, Low-molecular-mass heparin, Parnaparin sodium, Dalteparin sodium, European Pharmacopoeia, Molecular weight measurement, UV detector, RI detector, Low-Molecular-Mass Heparin Molecular weight calculation program, HPLC, Size exclusion chromatography, SEC, aqueous GPC
Results
Figure 1 Chromatogram of low-molecular-mass heparin for molecular weight measurement. Figure 2 and figure 3 chromatograms of parnaparin and dalteparin.
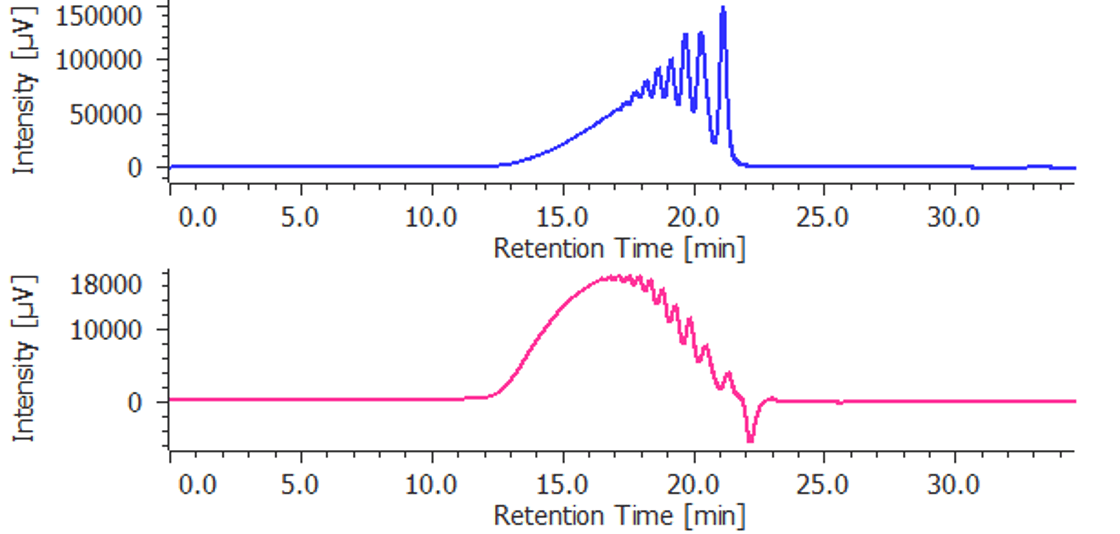
Figure 1. Chromatograms of low-molecular-mass heparin for molecular weight measurement (blue: UV detection, red: RI detection)
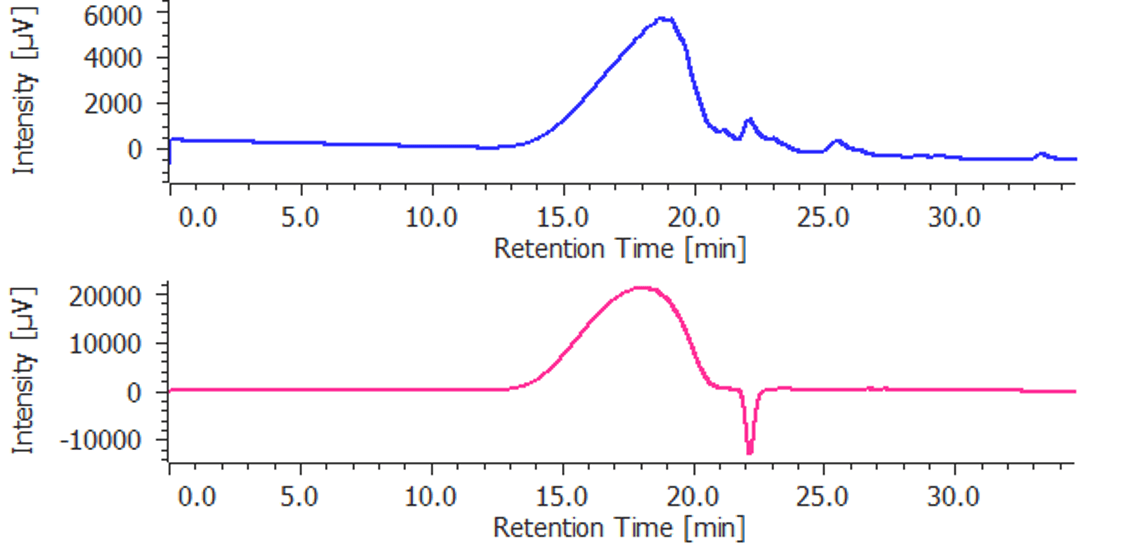
Figure 2. Chromatograms of parnaparin (blue: UV detection, red: RI detection)
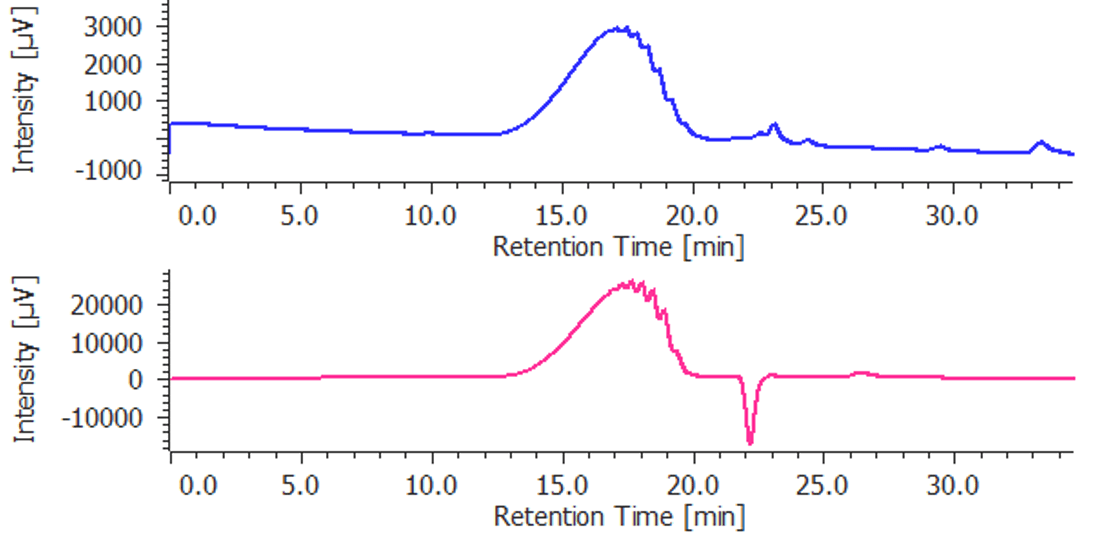
Figure 3. Chromatograms of dalteparin (blue: UV detection, red: RI detection)
The calibration curve made using the chromatogram of low-molecular-mass heparin for molecular weight measurement is created in the [Create Calibration Curve] view in the [Heparin Molecular Weight Calculation Method] window. Figure 4 shows the calibration curve created using three repeated chromatograms of the low-molecular-mass heparin for molecular weight measurement. The calibration curve can be set up to be created automatically.
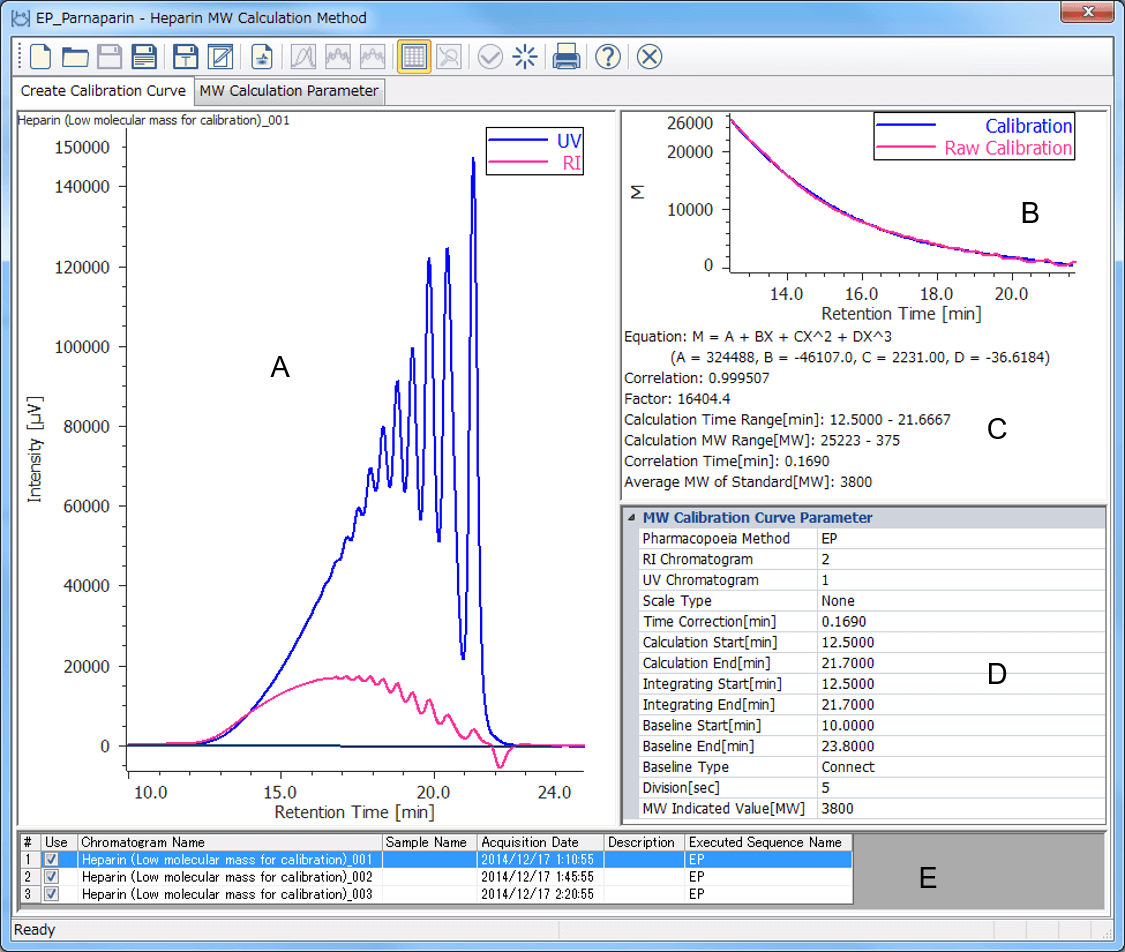
Figure 4. [Create Calibration Curve] window (A: Chromatogram view, B: Calibration curve view, C: Calibration curve information, D: Molecular weight calibration curve parameters, E: Chromatogram list)
[Molecular Weight Calculation Parameter] display in [Heparin Molecular Weight Calculation Method] window is used for setting range for calculation of molecular weight against a sample. Figure 5 shows [Molecular Weight Calculation Parameter] display of parnaparin after setting the range which is refined in European Pharmacopoeia. The range for calculating molecular weight distribution depends on each low-molecular-mass heparin sodium so that another [Heparin Molecular Weight Calculation Method] are prepared for dalteparin sodium.
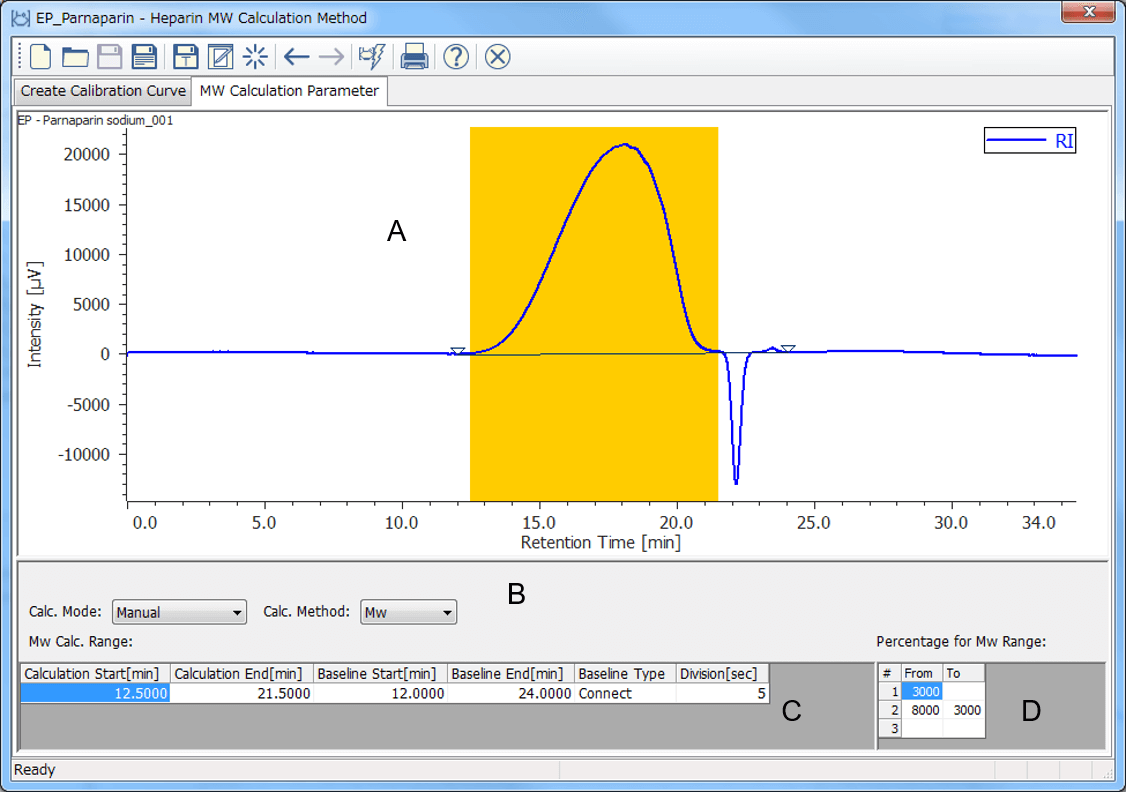
Figure 5. [Molecular Weight Calculation Parameter] window (A: Frame for chromatogram, B: Calculation mode and method, C: Range for molecular weight calculation, D: Percentage for molecular weight range)
A calculation result is displayed in [Heparin Molecular Weight Calculation Results View] by applying prepared [Heparin Molecular Weight Calculation Method] to chromatogram of a sample. Figure 6 shows [Heparin Molecular Weight Calculation Results View] of parnaparin sodium and dalteparin sodium. These are created by applying prepared [Heparin Molecular Weight Calculation Method] to their RI chromatograms. In this view, the UV chromatogram and the calibration curve can be overlayed to the RI chromatogram of a sample for determining the calculated average molecular weight and molecular weight distribution against the European Pharmacopoeia, calculation result table shown in figure 6 (c) is useful. By the way, parnaparin sodium and dalteparin sodium in this measurement satisfy the level in European Pharmacopoeia (Table 1).
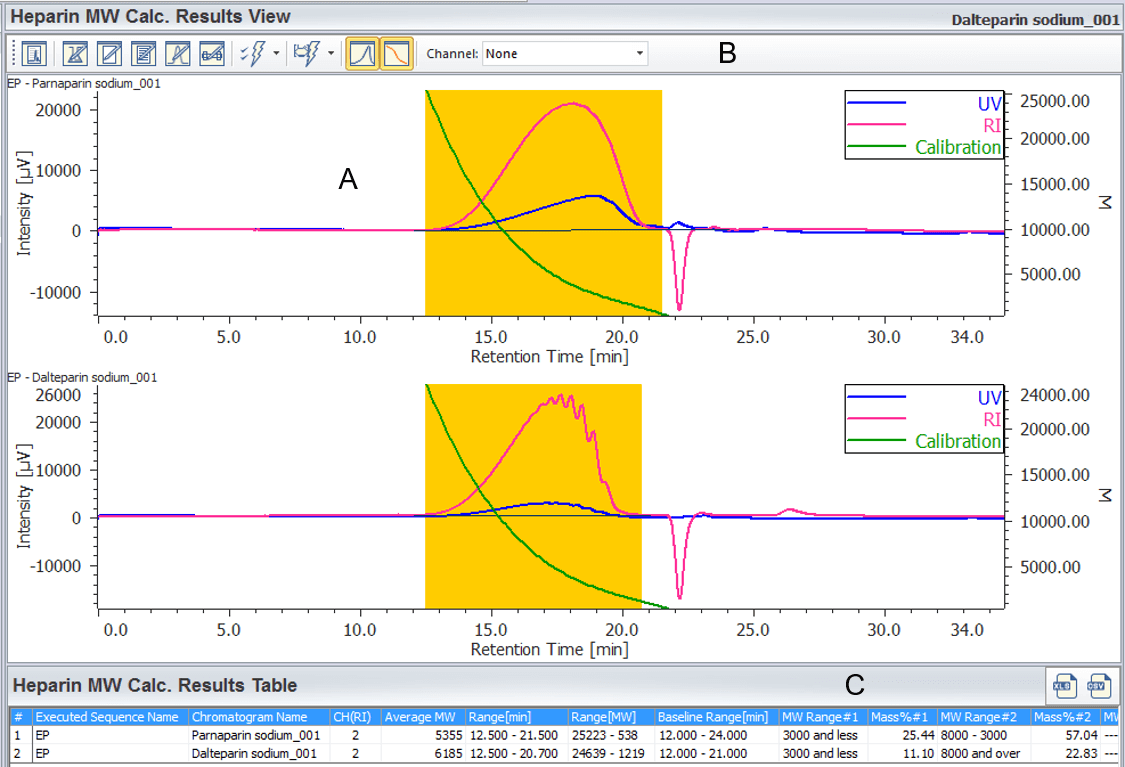
Figure 6. [Heparin Molecular Weight Calculation Result View] window (A: Frame for chromatogram, B: Tool buttons, C: Heparin Molecular Weight Calculation Results Table)
Table 1. Average molecular weight and molecular weight distribution in low-molecular- mass heparin sodium and calcium article of European Pharmacopoeia
| Low-molecular-mass heparins | Range of average molecular weight | Molecular weight distribution | |||||
| M < 2000 | M < 3000 | M 2000 – 4000 | M 2000 – 8000 | M 3000 – 8000 | M > 8000 | ||
| Parnaparin sodium | 4000 – 6000 | ≦30% | 50 – 60% | ||||
| Dalteparin sodium | 5600 – 6400 | ≦13% | 15 – 25% | ||||
| Enoxaparin sodium | 3800 – 5000 | 12 – 20% | 68 – 82% | ||||
| Tinzaparin sodium | 5500 – 7500 | ≦10% | 60 – 72% | 22 – 36% | |||
| Nadroparin calcium | 3600 – 5000 | ≦15% | 33 – 55% | 75 – 95% | |||
References
(1) European Pharmacopoeia 8.0 volume II,“Heparins, low-molecular-mass monograph 0828”, (2014), Council of Europe.
(2) European Pharmacopoeia 8.0 volume II,“Parnaparin sodium monograph 1252”, (2014), Council of Europe.
(3) European Pharmacopoeia 8.0 volume II,“Parnaparin sodium monograph 1252”, (2014), Council of Europe.
(4) European Pharmacopoeia 8.0 volume II,“Dalteparin sodium monograph 1195”, (2014), Council of Europe.
(5) European Pharmacopoeia 8.1 supplement,“Enoxaparin sodium monograph 1097”, (2014), Council of Europe.
(6) European Pharmacopoeia 8.0 volume II,“Tinzaparin sodium monograph 1271”, (2014), Council of Europe.
(7) European Pharmacopoeia 8.0 volume II,“Nadroparin calcium monograph 1134”, (2014), Council of Europe.


