Introduction
Polycyclic Aromatic Hydrocarbons (PAHs) are produced by the incomplete combustion of organic compounds from various sources including diesel exhaust, coal dust, and cigarette smoke; many are strongly carcinogenic. PAHs are subject to regulation by various organizations including the EPA (United States Environmental Protection Agency). These regulations strictly control the impact of PAHs on environmental pollution and their effects on human health.
PAHs exhibit strong natural fluorescence due to the aromatic structure with many conjugated double bonds. This make fluorescence detection extremely sensitive and necessary for the low levels often found in the environment.
In this application note, 16 PAHs were separated by supercritical fluid chromatography (SFC) and detected using an FP-4020 fluorescence detector (FL detector) with high pressure cell. For a sensitivity evaluation, a comparison of detection using fluorescence and UV-visible absorbance (UV/Vis detector) was performed.
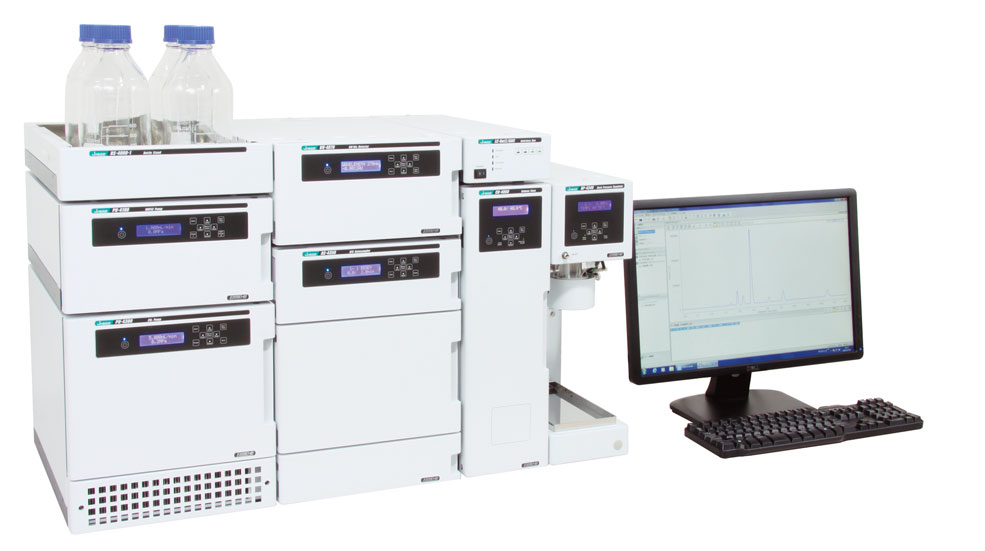
LC-4000 SFC system
Experimental
Experimental conditions
Column: 2-Ethylpyridine (Princeton Chromatography) (4.6 mm I.D. x 250 mm L, 5 µm)
Eluent A: CO2
Eluent B: Acetonitrile
Gradient: (A/B), 0 min (95/5) → 1.5 min (95/5) → 12 min (80/20) → 14 min (80/20) → 15 min (95/5) → 20 min (95/5)
Flow rate: 3.0 mL/min
Column temp.: 40 ̊C
Wavelength: Refer to Figure 1.
Back pressure: 15 MPa
Injection volume: 5 µL
Standard sample: Mixture of 16 PAHs standards in acetonitrile
Structure of PAHs

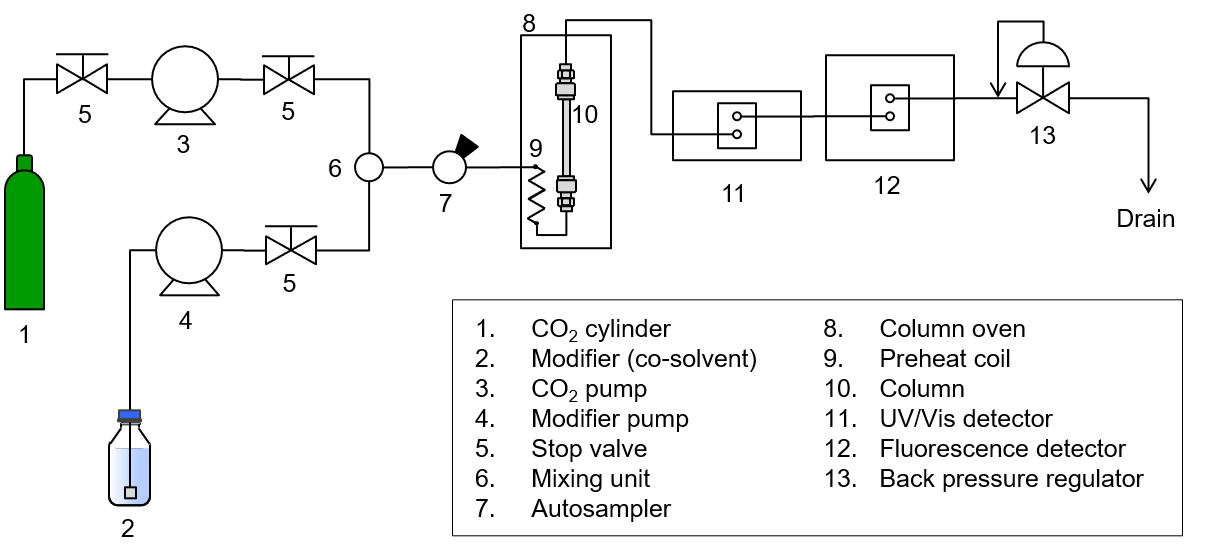
SFC System Schematic
Keywords
Polycyclic Aromatic Hydrocarbons, PAHs, Ethylpyridine column, SFC, Fluorescence detector, carcinogenicity, UV-Vis absorbance detector
Results
Figure 1 shows the separation of a 16-component PAHs standard mixture with UV-visible detection (500 pg/µL each) and fluorescence detection (5 pg/µL each).
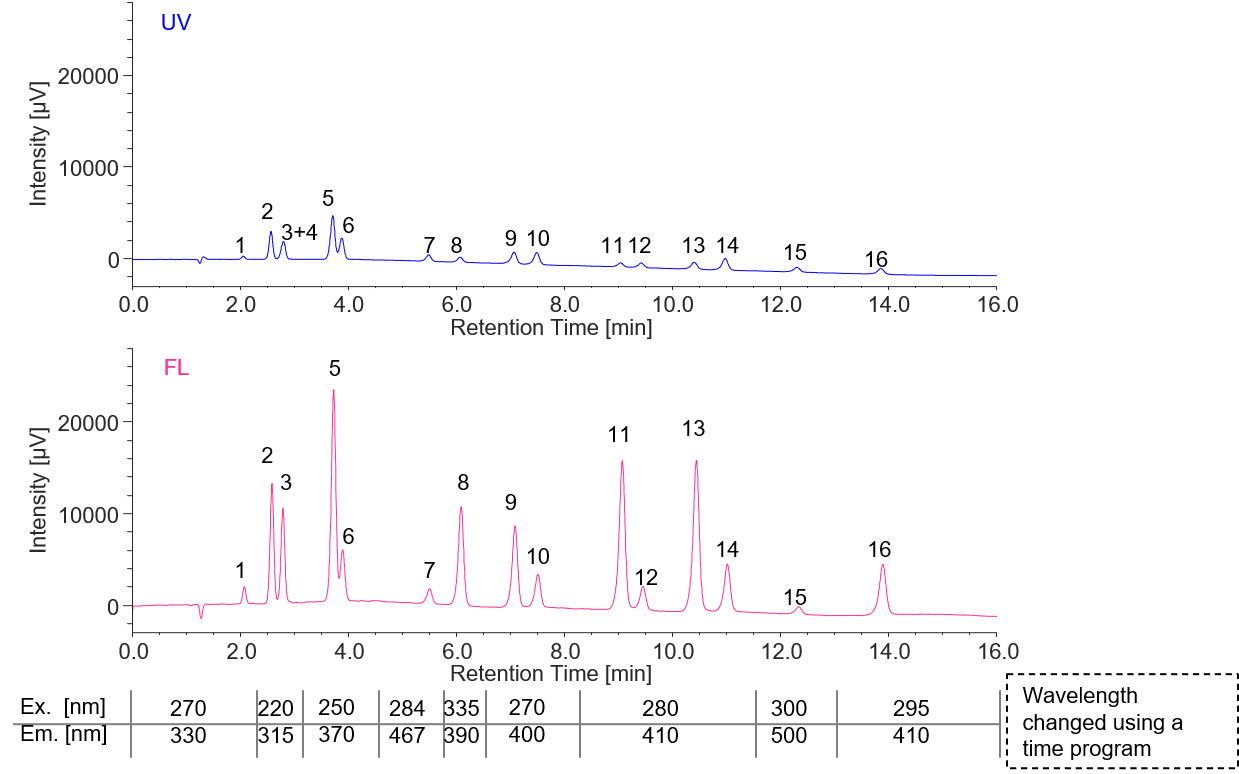
Figure 1 UV and FL chromatogram of PAHs 16-component (UV: 500 pg/µL, FL: 5 pg/µL, 1: Naphthalene, 2: Acenaphthene, 3: Fluorene, 4: Acenaphthylene (non-fluorescent), 5: Anthracene, 6: Phenanthrene, 7: Fluoranthene, 8: Pyrene, 9: Benzo[a]anthracene, 10: Chrysene, 11: Benzo[k]fluoranthene, 12: Benzo[b]fluoranthene, 13: Benzo[a]pyrene, 14: Dibenzo[a,h]anthracene, 15: Indeno[1,2,3-cd]pyrene, 16: Benzo[g,h,i]perylene, The measurement wavelength used for the UV/Visible detector is the same as the excitation wavelength of the fluorescence detector. The gain of the fluorescence detector is x100.)
Since Acenaphthylene does not fluoresce, it was not detected in the fluorescence chromatogram and was co-eluted with Fluorene (peak No. 3) overlapping in the UV chromatogram. Table 1 shows the detection limits of each component.
Table 1 Lower limit of detection of PAHs in each detector and linearity in FL detector
| Peak No. | Compound | Detection limit [pg] | Sensitivity ratio*3 | Correlation coefficient (FL)*4 | |
| UV*1 | FL*2 | ||||
| 1 | Naphthalene | 120 | 2.04 | 59 | 1.0000 |
| 2 | Acenaphthene | 13.6 | 0.293 | 46 | 0.9998 |
| 3 | Fluorene*5 | 21.3 | 0.369 | 58 | 0.9999 |
| 5 | Anthracene | 8.67 | 0.166 | 52 | 0.9998 |
| 6 | Phenanthrene | 17.8 | 0.676 | 26 | 1.0000 |
| 7 | Fluoranthene | 58.8 | 2.34 | 25 | 0.9999 |
| 8 | Pyrene | 75.2 | 0.357 | 211 | 0.9998 |
| 9 | Benzo[a]anthrancene | 32.5 | 0.432 | 75 | 0.9999 |
| 10 | Chrysene | 31.5 | 1.06 | 30 | 1.0000 |
| 11 | Benzo[k]fluoranthene | 93.0 | 0.236 | 393 | 0.9997 |
| 12 | Benzo[b]fluoranthene | 81.9 | 1.46 | 56 | 0.9999 |
| 13 | Benzo[a]pyrene | 53.6 | 0.233 | 230 | 0.9998 |
| 14 | Dibenz[a,h]anthracene | 32.6 | 0.737 | 44 | 1.0000 |
| 15 | Indeno[1,2,3-cd]pyrene | 79.2 | 4.61 | 17 | 0.9998 |
| 16 | Benzo[g,h,i]perylene | 65.5 | 0.697 | 94 | 0.9998 |
| *1 Calculated from the measurement of 500 pg/mL standard sample (S/N=3) *2 Calculated from the measurement of 5 pg/mL standard sample (S/N=3) *3 Lower limit of detection of UV detector/Lower limit of detection of FL detector *4 Calibration curve was made using standards at 1, 5, 10, 50, 100 pg/mL *5 The value of the Fluorene peak using UV detection includes Acenaphthylene which is co-eluted. |
|||||
Using the fluorescence detector, the PAHs were detected at the low detection limit of 0.17 pg to 4.6 pg, and the sensitivity ratio compared with the UV detector is approx. 20 to 400 times. Figure 2 shows a calibration curve for the standard PAH mixture at concentrations from 1 to 100 pg/µL measured with the fluorescence detector. From these results (Table 1), excellent linearity with a correlation coefficient of 0.9997 or higher was confirmed for all components.
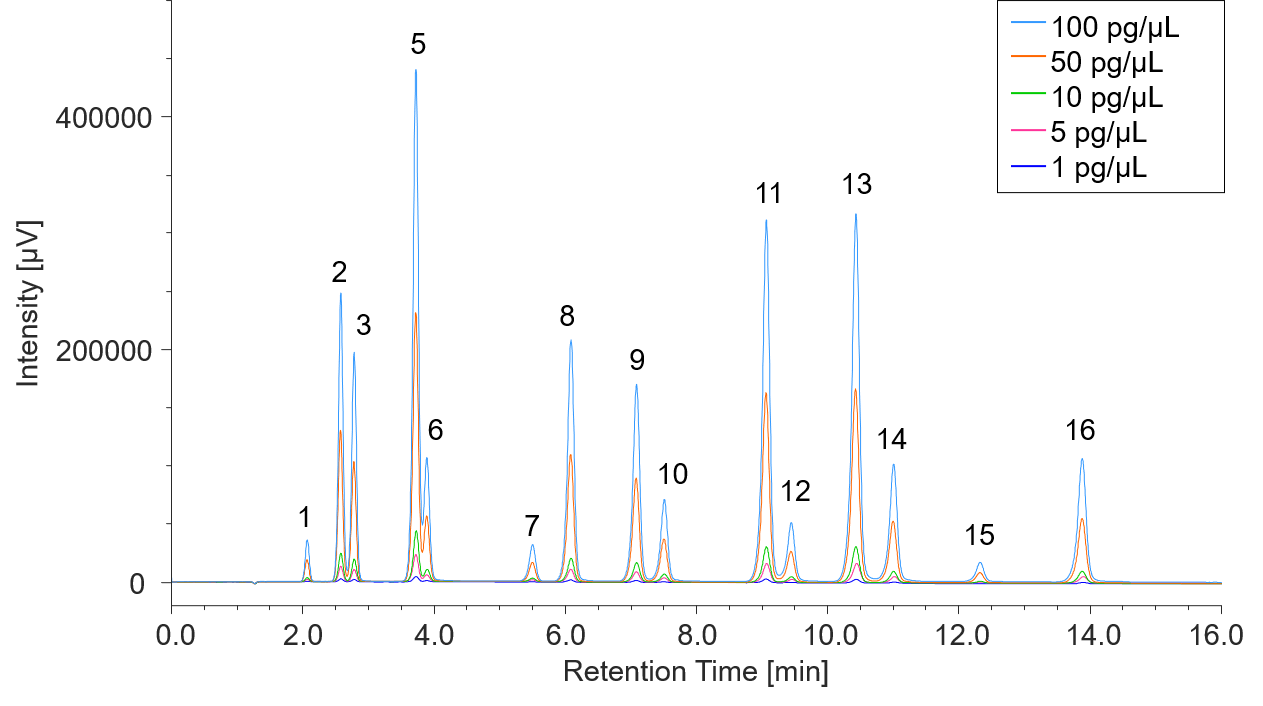
Figure 2 FL chromatogram of PAHs 16-components ( 1: Naphthalene, 2: Acenaphthene, 3: Fluorene, 4: Acenaphthylene (non-fluorescent), 5: Anthracene, 6: Phenanthrene, 7: Fluoranthene, 8: Pyrene, 9: Benzo[a]anthracene, 10: Chrysene, 11: Benzo[k]fluoranthene, 12: Benzo[b]fluoranthene, 13: Benzo[a]pyrene, 14: Dibenzo[a,h]anthracene, 15: Indeno[1,2,3-cd]pyrene, 16: Benzo[g,h,i]perylene Measurement wavelength and gain set for the fluorescence detector is the same as Figure 1.)
Related Posts:
") Chiral preparative separation of warfarin using…
Chiral preparative separation of warfarin using…") Achiral preparative separation using Preparative SFC…
Achiral preparative separation using Preparative SFC… Comparison of Separation Behavior among Silica-based…
 Rapid Column Screening for Chiral Separation by Parallel SFC
 Increased Productivity of Chiral Separation in…
 Analysis of Flavanone by SFC-PDA-CD Method Scouting…