Introduction
Polycyclic aromatic hydrocarbons (PAHs) are comprised of aromatic rings, and are produced by the incomplete combustion of hydro-carbon containing materials such as diesel oil and coal. Some PAHs are known to be carcinogenic and so the detection and quantitative determination of environmental PAHs is extremely important.
HPLC with a fluorescence detector can be used for very high sensitivity detection of these samples types by carefully selecting the optimal excitation and emission wavelength pairs for each target analyte.
In this article, the excitation and emission spectra for each PAH was measured using the auto-scan function of the FP-4020 fluorescence detector and control and analysis software ChromNAV 2.0.
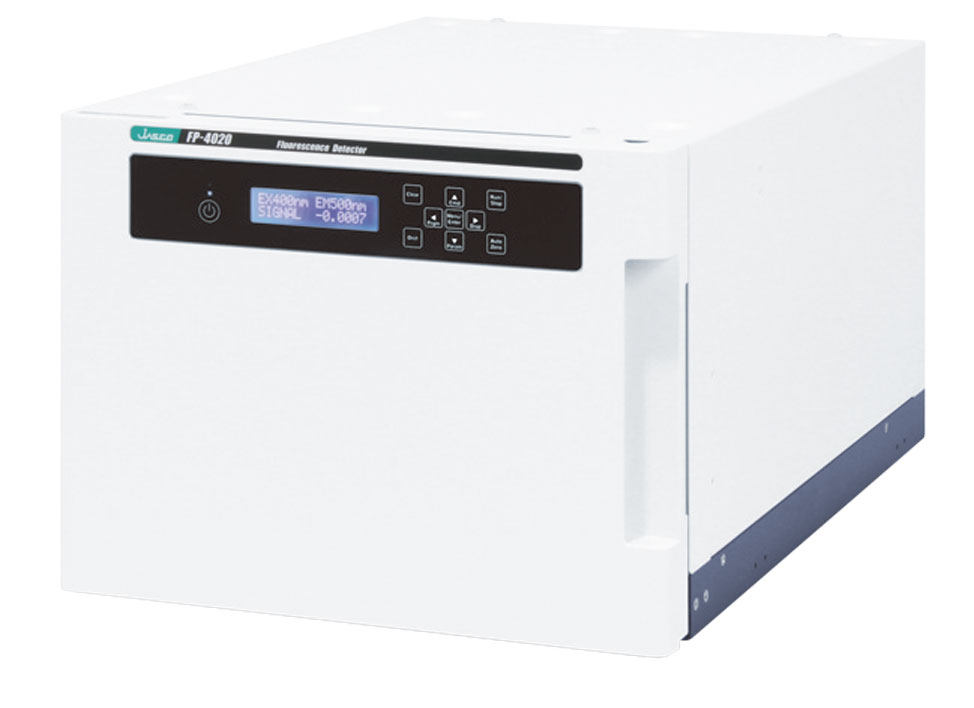
Fluorescence detector (FP-4020)
Experimental
Column: CrestPak C18S (4.6 mmI.D. x 150 mmL, 5 µm)
Eluent: Acetonitrile/Water (78/22)
Flow rate: 1.0 mL/min
Column temp.: 40 ̊C
Wavelength: Time program (see Table 1)
Cell temp.: 20 ̊C
Injection volume: 1 µL
Standard: Mixture of 10 µg/mL naphthalene, 1 µg/mL fluorene, anthracene, pyrene chrysene and benzo[a]pyrene in methanol
Table 1. Time program
| Time (min.)/td> | Excitation wavelength (nm) | Emission wavelength (nm) |
| 0.0 | 276 | 334 |
| 3.5 | 266 | 310 |
| 4.1 | 250 | 402 |
| 5.0 | 336 | 392 |
| 6.0 | 268 | 384 |
| 8.5 | 262 | 408 |
Keywords
PAHs, CrestPak C18S, HPLC, fluorescence detector, Excitation spectrum, Fluorescence spectrum, Auto-scan, naphthalene, fluorene, anthracene, pyrene, chrysene, benzo[a]pyrene
Results
Figure 1 shows the chromatogram of 6 PAHs with excitation spectrum scan. The scan was performed by setting a threshold value*. The flat peak section occurs during the movement of the monochromator during the scan.
*10000 μV: Naphthalene, Fluorene, Anthracene, Chrysene, Benzo[a]pyrene
*5000 μV: Pyrene
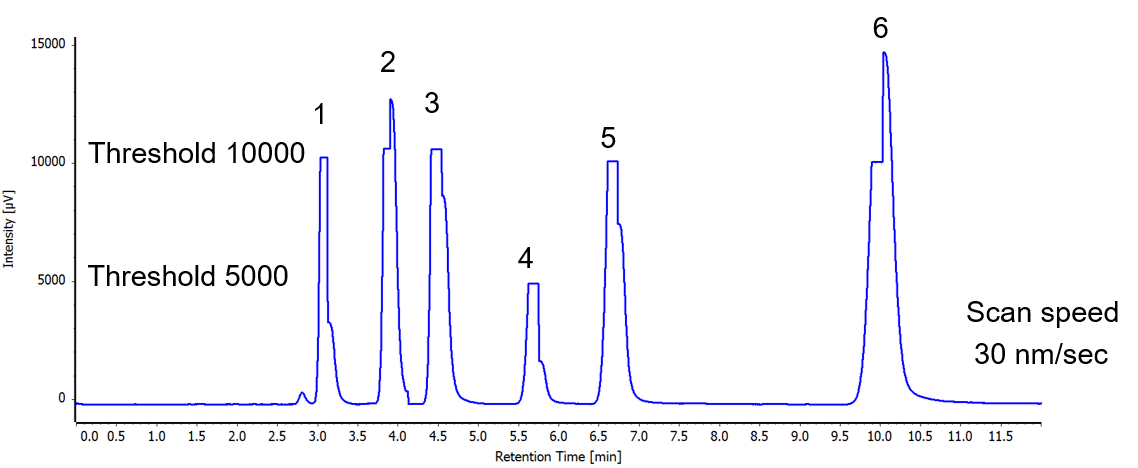
Figure 1. Chromatogram of PAHs 6 components by excitation spectrum auto scan (1: Naphthalene, 2: Fluorene, 3: Anthracene, 4: Pyrene, 5: Chrysene, 6: Benzo[a]pyrene)
Figure 2 shows the excitation spectrum of each component using the spectrum auto-scan function.
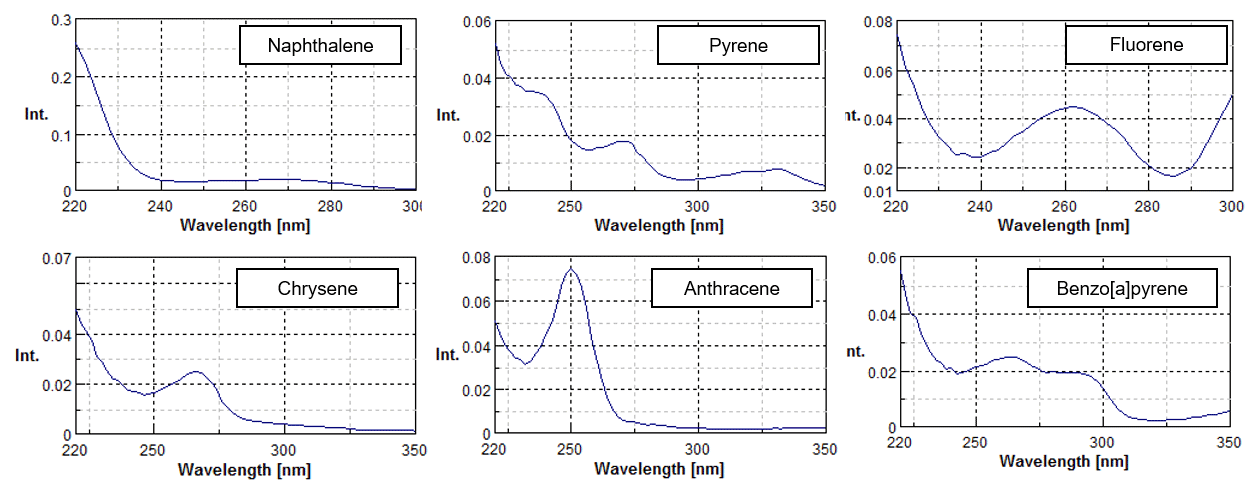
Figure 2. Excitation spectrum of each PAHs sample by the spectrum auto scan
Spectra Manager™ is included as standard with ChromNAV 2.0 for the detailed analysis of spectral data. Figure 3 shows the peak detection parameters window and its result window. By using the peak detection function the wavelength maxima can be easily found from the excitation and emission spectra.
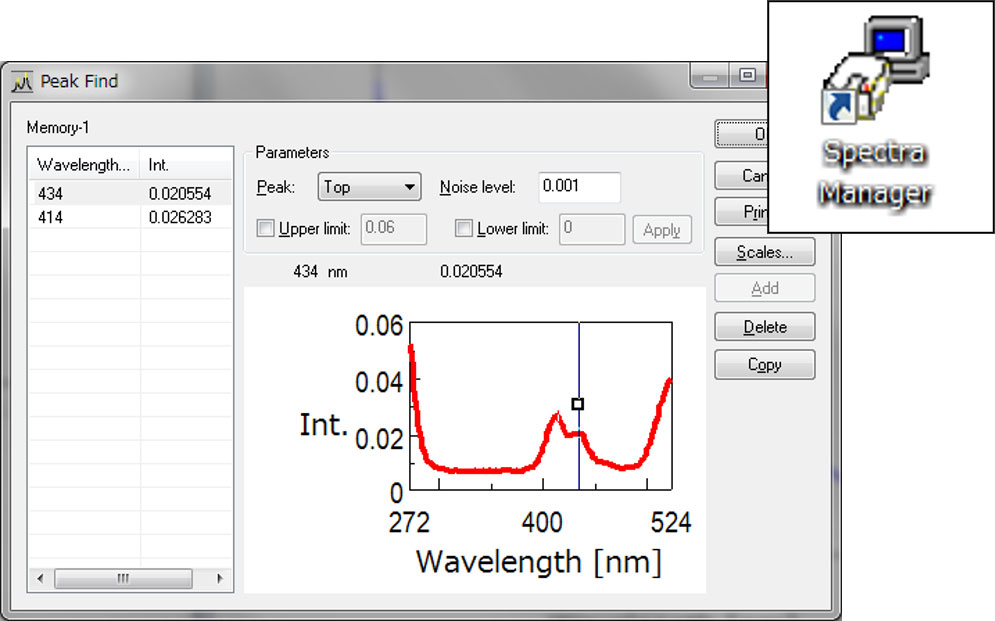
Figure 3. Spectra Manager ™ window (Left: detection setting, Right: result of detection)
Figure 4 shows the chromatogram of 6 PAHs using emission spectrum scan. The scan is executed by setting a threshold value*.
*10000 μV: Naphthalene, Fluorene, Anthracene, Chrysene, Benzo[a]pyrene
*5000 μV: Pyrene
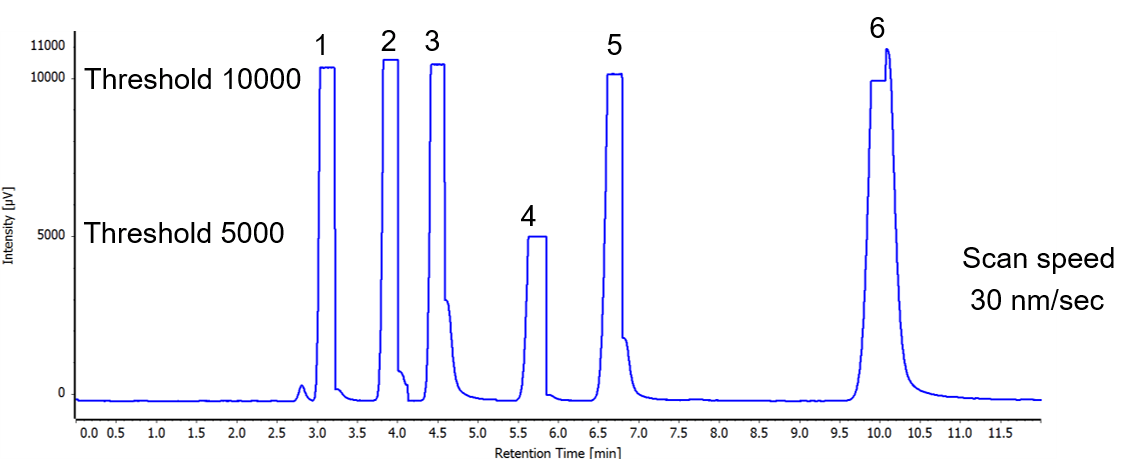
Figure 4. Chromatogram using fluorescence spectrum auto-scan (1: Naphthalene, 2: Fluorene, 3: Anthracene, 4: Pyrene, 5: Chrysene, 6: Benzo[a]pyrene)
Figure 5 Parameter window for spectrum auto-scan in ChromNAV. When creating a “Control Method”, the detector is selected and the parameters are set in the “Time Program” tab. In this tab, excitation and emission wavelengths for each sample, and the starting and end time for auto-scan are set.
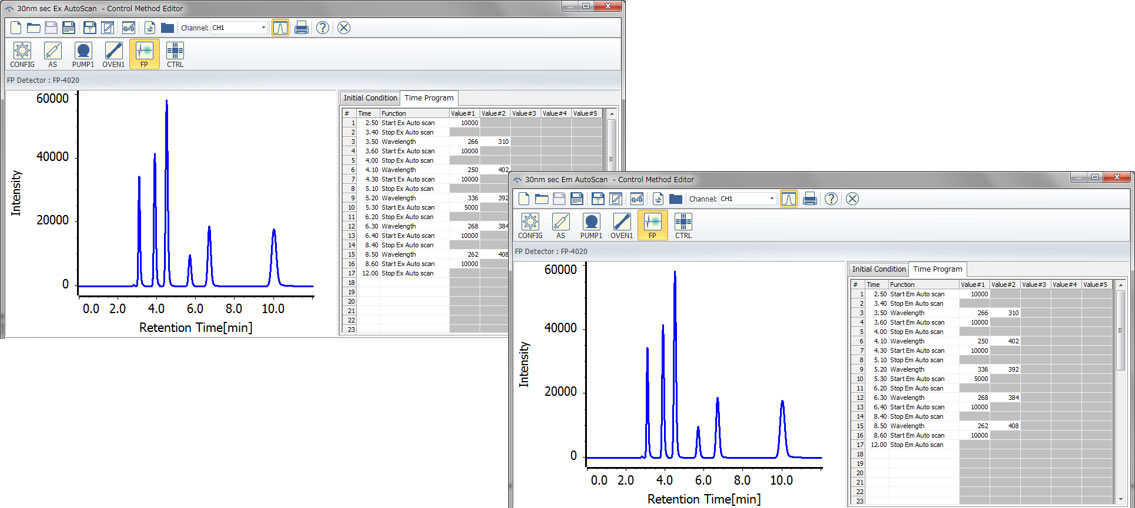
Figure 5. Spectrum auto-scan parameter window in ChromNAV (Top: Ex auto scan, Bottom: Em auto-scan)
Figure 6 shows the emission spectrum for each sample using spectrum auto scan.
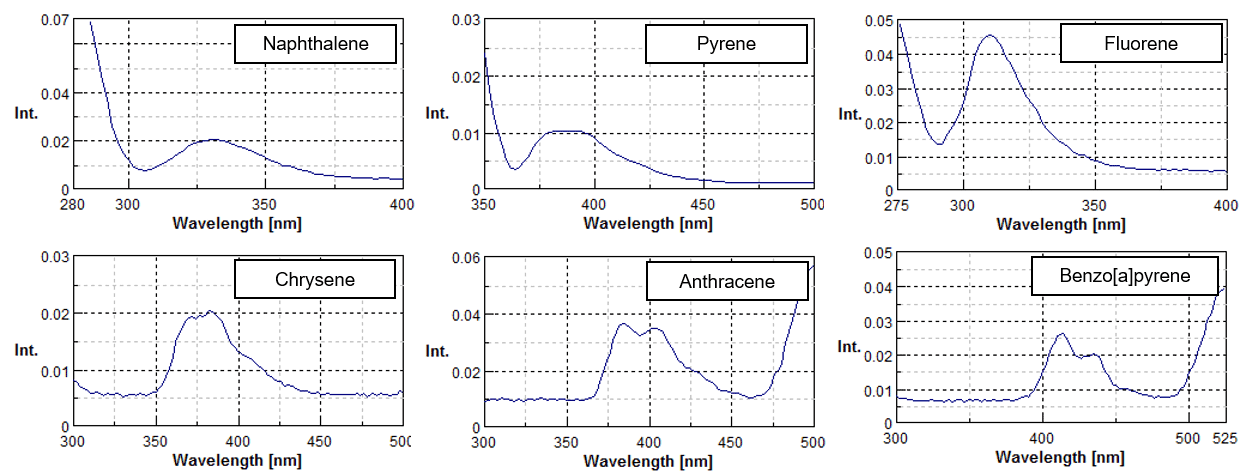
Figure 6. Fluorescence spectrum of each PAH using spectrum auto-scan


